|
Download Data (XLS File) |
|
||||||||
|
||||||||
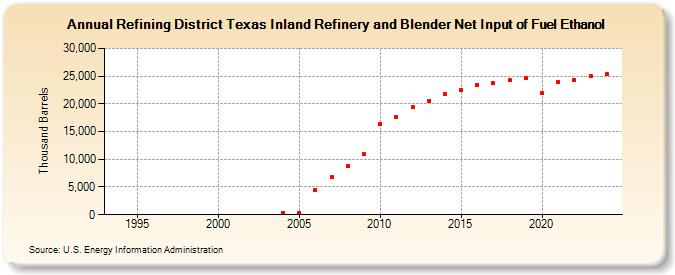
| Refining District Texas Inland Refinery and Blender Net Input of Fuel Ethanol (Thousand Barrels) | ||||||||
| Decade | Year-0 | Year-1 | Year-2 | Year-3 | Year-4 | Year-5 | Year-6 | Year-7 | Year-8 | Year-9 |
|---|---|---|---|---|---|---|---|---|---|---|
| 1990's | W | W | W | W | W | W | W | |||
| 2000's | W | W | W | W | 343 | 349 | 4,509 | 6,750 | 8,803 | 10,916 |
| 2010's | 16,356 | 17,561 | 19,356 | 20,476 | 21,744 | 22,503 | 23,374 | 23,725 | 24,245 | 24,678 |
| 2020's | 21,940 | 23,952 | 24,361 | 24,922 |
| - = No Data Reported; -- = Not Applicable; NA = Not Available; W = Withheld to avoid disclosure of individual company data. |
| Release Date: 6/28/2024 |
| Next Release Date: 8/30/2024 |