|
Download Data (XLS File) |
|
||||||||
|
||||||||
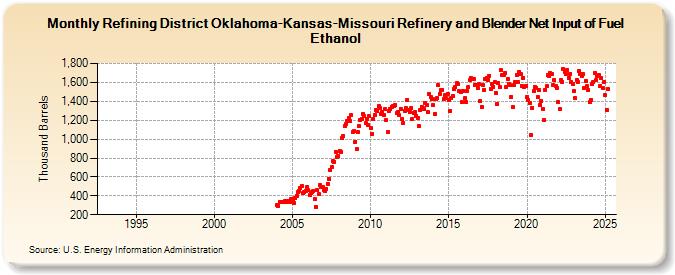
| Refining District Oklahoma-Kansas-Missouri Refinery and Blender Net Input of Fuel Ethanol (Thousand Barrels) | ||||||||
| Year | Jan | Feb | Mar | Apr | May | Jun | Jul | Aug | Sep | Oct | Nov | Dec |
|---|---|---|---|---|---|---|---|---|---|---|---|---|
| 1993 | W | W | W | W | W | W | W | W | W | W | W | W |
| 1994 | W | W | W | W | W | W | W | W | W | W | W | W |
| 1995 | W | W | W | W | W | W | W | W | W | W | W | W |
| 1996 | W | W | W | W | W | W | W | W | W | W | W | W |
| 1997 | W | W | W | W | W | W | W | W | W | W | W | W |
| 1998 | W | W | W | W | W | W | W | W | W | W | W | W |
| 1999 | W | W | W | W | W | W | W | W | W | W | W | W |
| 2000 | W | W | W | W | W | W | W | W | W | W | W | W |
| 2001 | W | W | W | W | W | W | W | W | W | W | W | W |
| 2002 | W | W | W | W | W | W | W | W | W | W | W | W |
| 2003 | W | W | W | W | W | W | W | W | W | W | W | W |
| 2004 | 305 | 297 | 333 | 334 | 336 | 334 | 344 | 337 | 340 | 345 | 331 | 365 |
| 2005 | 340 | 328 | 372 | 401 | 439 | 456 | 482 | 508 | 427 | 436 | 453 | 497 |
| 2006 | 457 | 412 | 429 | 444 | 455 | 368 | 283 | 460 | 418 | 515 | 493 | 492 |
| 2007 | 465 | 454 | 474 | 530 | 583 | 670 | 708 | 765 | 762 | 864 | 811 | 823 |
| 2008 | 872 | 862 | 1,009 | 1,035 | 1,136 | 1,157 | 1,193 | 1,225 | 1,190 | 1,250 | 1,072 | 1,081 |
| 2009 | 974 | 894 | 1,075 | 1,139 | 1,207 | 1,211 | 1,266 | 1,240 | 1,166 | 1,217 | 1,148 | 1,240 |
| 2010 | 1,115 | 1,059 | 1,216 | 1,255 | 1,309 | 1,293 | 1,349 | 1,333 | 1,269 | 1,287 | 1,253 | 1,316 |
| 2011 | 1,202 | 1,070 | 1,301 | 1,315 | 1,341 | 1,351 | 1,353 | 1,356 | 1,274 | 1,287 | 1,250 | 1,320 |
| 2012 | 1,212 | 1,172 | 1,301 | 1,326 | 1,417 | 1,305 | 1,290 | 1,325 | 1,208 | 1,281 | 1,286 | 1,249 |
| 2013 | 1,227 | 1,134 | 1,306 | 1,340 | 1,333 | 1,318 | 1,380 | 1,360 | 1,284 | 1,478 | 1,442 | 1,426 |
| 2014 | 1,360 | 1,263 | 1,427 | 1,431 | 1,569 | 1,475 | 1,521 | 1,523 | 1,423 | 1,466 | 1,434 | 1,481 |
| 2015 | 1,418 | 1,300 | 1,434 | 1,461 | 1,530 | 1,546 | 1,591 | 1,582 | 1,506 | 1,498 | 1,390 | 1,509 |
| 2016 | 1,432 | 1,393 | 1,512 | 1,546 | 1,626 | 1,649 | 1,635 | 1,637 | 1,573 | 1,574 | 1,544 | 1,578 |
| 2017 | 1,402 | 1,341 | 1,569 | 1,522 | 1,638 | 1,650 | 1,628 | 1,668 | 1,528 | 1,586 | 1,556 | 1,599 |
| 2018 | 1,491 | 1,370 | 1,595 | 1,555 | 1,732 | 1,680 | 1,683 | 1,704 | 1,556 | 1,637 | 1,579 | 1,568 |
| 2019 | 1,448 | 1,335 | 1,573 | 1,602 | 1,681 | 1,600 | 1,709 | 1,685 | 1,565 | 1,647 | 1,556 | 1,561 |
| 2020 | 1,448 | 1,414 | 1,377 | 1,047 | 1,330 | 1,504 | 1,554 | 1,543 | 1,446 | 1,517 | 1,366 | 1,403 |
| 2021 | 1,323 | 1,197 | 1,521 | 1,558 | 1,678 | 1,665 | 1,698 | 1,691 | 1,577 | 1,625 | 1,562 | 1,545 |
| 2022 | 1,395 | 1,315 | 1,620 | 1,609 | 1,742 | 1,712 | 1,689 | 1,735 | 1,647 | 1,693 | 1,602 | 1,584 |
| 2023 | 1,506 | 1,430 | 1,625 | 1,609 | 1,720 | 1,687 | 1,666 | 1,688 | 1,540 | 1,616 | 1,557 | 1,521 |
| 2024 | 1,389 | |||||||||||
| - = No Data Reported; -- = Not Applicable; NA = Not Available; W = Withheld to avoid disclosure of individual company data. |
| Release Date: 3/29/2024 |
| Next Release Date: 4/30/2024 |