|
Download Data (XLS File) |
|
||||||||
|
||||||||
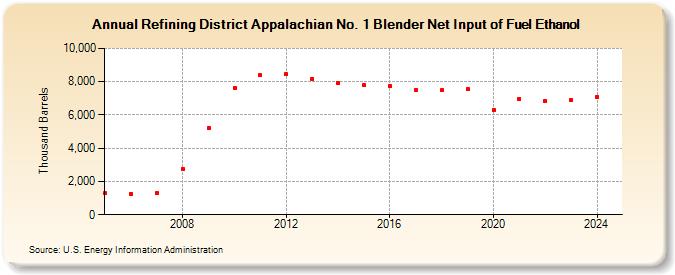
| Refining District Appalachian No. 1 Blender Net Input of Fuel Ethanol (Thousand Barrels) | ||||||||
| Decade | Year-0 | Year-1 | Year-2 | Year-3 | Year-4 | Year-5 | Year-6 | Year-7 | Year-8 | Year-9 |
|---|---|---|---|---|---|---|---|---|---|---|
| 2000's | 1,285 | 1,254 | 1,281 | 2,749 | 5,220 | |||||
| 2010's | 7,621 | 8,374 | 8,452 | 8,183 | 7,908 | 7,803 | 7,729 | 7,501 | 7,476 | 7,550 |
| 2020's | 6,303 | 6,976 | 6,818 | 6,844 |
| - = No Data Reported; -- = Not Applicable; NA = Not Available; W = Withheld to avoid disclosure of individual company data. |
| Release Date: 3/29/2024 |
| Next Release Date: 8/30/2024 |
Referring Pages: