|
Download Data (XLS File) |
|
||||||||
|
||||||||
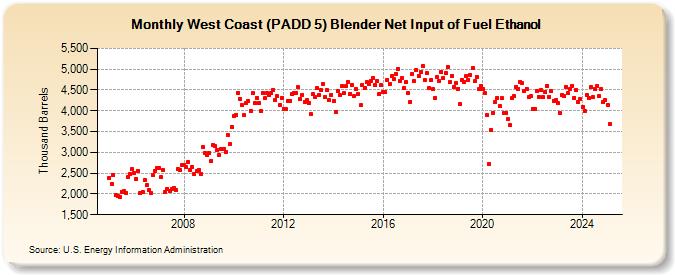
| West Coast (PADD 5) Blender Net Input of Fuel Ethanol (Thousand Barrels) | ||||||||
| Year | Jan | Feb | Mar | Apr | May | Jun | Jul | Aug | Sep | Oct | Nov | Dec |
|---|---|---|---|---|---|---|---|---|---|---|---|---|
| 2005 | 2,394 | 2,240 | 2,455 | 1,967 | 1,942 | 1,929 | 2,053 | 2,063 | 2,027 | 2,412 | 2,477 | 2,592 |
| 2006 | 2,514 | 2,358 | 2,560 | 2,011 | 2,049 | 2,334 | 2,212 | 2,085 | 2,027 | 2,453 | 2,560 | 2,632 |
| 2007 | 2,633 | 2,402 | 2,574 | 2,051 | 2,123 | 2,065 | 2,116 | 2,148 | 2,100 | 2,601 | 2,585 | 2,689 |
| 2008 | 2,697 | 2,636 | 2,773 | 2,565 | 2,645 | 2,474 | 2,556 | 2,576 | 2,486 | 3,118 | 2,993 | 2,935 |
| 2009 | 2,995 | 2,801 | 3,180 | 3,144 | 3,054 | 2,939 | 3,079 | 3,085 | 2,998 | 3,423 | 3,200 | 3,615 |
| 2010 | 3,875 | 3,903 | 4,439 | 4,289 | 4,127 | 3,891 | 4,181 | 4,238 | 4,003 | 4,421 | 4,182 | 4,317 |
| 2011 | 4,186 | 3,984 | 4,432 | 4,295 | 4,424 | 4,369 | 4,420 | 4,505 | 4,264 | 4,351 | 4,130 | 4,312 |
| 2012 | 4,054 | 4,032 | 4,241 | 4,233 | 4,393 | 4,418 | 4,435 | 4,563 | 4,277 | 4,391 | 4,208 | 4,255 |
| 2013 | 4,183 | 3,915 | 4,396 | 4,342 | 4,538 | 4,385 | 4,494 | 4,645 | 4,328 | 4,493 | 4,248 | 4,381 |
| 2014 | 4,238 | 3,960 | 4,478 | 4,370 | 4,590 | 4,419 | 4,591 | 4,689 | 4,411 | 4,615 | 4,344 | 4,514 |
| 2015 | 4,399 | 4,131 | 4,625 | 4,547 | 4,682 | 4,643 | 4,714 | 4,799 | 4,614 | 4,717 | 4,412 | 4,615 |
| 2016 | 4,461 | 4,448 | 4,750 | 4,648 | 4,834 | 4,752 | 4,896 | 5,014 | 4,725 | 4,788 | 4,547 | 4,691 |
| 2017 | 4,439 | 4,217 | 4,886 | 4,710 | 4,976 | 4,843 | 4,933 | 5,080 | 4,739 | 4,903 | 4,551 | 4,740 |
| 2018 | 4,517 | 4,314 | 4,806 | 4,708 | 4,925 | 4,782 | 4,904 | 5,061 | 4,697 | 4,847 | 4,578 | 4,664 |
| 2019 | 4,534 | 4,154 | 4,743 | 4,702 | 4,831 | 4,742 | 4,868 | 5,029 | 4,710 | 4,820 | 4,514 | 4,602 |
| 2020 | 4,519 | 4,420 | 3,901 | 2,717 | 3,543 | 3,955 | 4,219 | 4,312 | 4,115 | 4,297 | 3,946 | 3,950 |
| 2021 | 3,800 | 3,649 | 4,300 | 4,353 | 4,583 | 4,534 | 4,695 | 4,662 | 4,467 | 4,534 | 4,325 | 4,355 |
| 2022 | 4,052 | 4,043 | 4,467 | 4,337 | 4,488 | 4,321 | 4,440 | 4,604 | 4,339 | 4,479 | 4,243 | 4,249 |
| 2023 | 4,190 | 3,953 | 4,371 | 4,343 | 4,577 | 4,416 | 4,527 | 4,605 | 4,310 | 4,490 | 4,208 | 4,274 |
| 2024 | 4,102 | |||||||||||
| - = No Data Reported; -- = Not Applicable; NA = Not Available; W = Withheld to avoid disclosure of individual company data. |
| Release Date: 3/29/2024 |
| Next Release Date: 4/30/2024 |
Referring Pages: