|
Download Data (XLS File) |
|
||||||||
|
||||||||
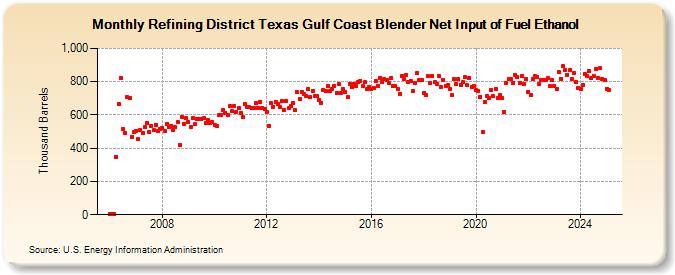
| Refining District Texas Gulf Coast Blender Net Input of Fuel Ethanol (Thousand Barrels) | ||||||||
| Year | Jan | Feb | Mar | Apr | May | Jun | Jul | Aug | Sep | Oct | Nov | Dec |
|---|---|---|---|---|---|---|---|---|---|---|---|---|
| 2006 | 2 | 3 | 3 | 349 | 664 | 822 | 514 | 492 | 707 | 700 | 466 | 497 |
| 2007 | 505 | 454 | 509 | 494 | 525 | 553 | 495 | 535 | 507 | 539 | 505 | 516 |
| 2008 | 519 | 506 | 545 | 528 | 533 | 512 | 526 | 555 | 421 | 588 | 547 | 580 |
| 2009 | 556 | 530 | 580 | 544 | 573 | 573 | 577 | 580 | 550 | 570 | 551 | 555 |
| 2010 | 540 | 536 | 601 | 599 | 632 | 613 | 597 | 651 | 621 | 655 | 618 | 641 |
| 2011 | 611 | 586 | 666 | 648 | 646 | 643 | 642 | 670 | 644 | 678 | 641 | 637 |
| 2012 | 618 | 533 | 671 | 649 | 680 | 663 | 649 | 685 | 632 | 685 | 640 | 651 |
| 2013 | 673 | 628 | 735 | 698 | 738 | 727 | 715 | 755 | 706 | 746 | 714 | 716 |
| 2014 | 690 | 672 | 750 | 743 | 771 | 741 | 756 | 775 | 732 | 785 | 732 | 755 |
| 2015 | 738 | 705 | 788 | 770 | 787 | 773 | 799 | 806 | 772 | 795 | 754 | 768 |
| 2016 | 753 | 761 | 806 | 776 | 821 | 796 | 813 | 811 | 793 | 823 | 776 | 772 |
| 2017 | 754 | 724 | 833 | 814 | 840 | 800 | 806 | 745 | 793 | 854 | 807 | 807 |
| 2018 | 734 | 719 | 831 | 789 | 835 | 795 | 788 | 831 | 767 | 812 | 773 | 777 |
| 2019 | 756 | 719 | 813 | 785 | 815 | 781 | 796 | 827 | 778 | 823 | 770 | 774 |
| 2020 | 749 | 745 | 709 | 496 | 680 | 711 | 700 | 750 | 715 | 758 | 700 | 717 |
| 2021 | 703 | 615 | 793 | 814 | 813 | 793 | 841 | 825 | 789 | 835 | 787 | 815 |
| 2022 | 738 | 720 | 813 | 832 | 827 | 786 | 811 | 810 | 812 | 820 | 772 | 808 |
| 2023 | 764 | 753 | 872 | 810 | 881 | 884 | 842 | 853 | 836 | 843 | 790 | 774 |
| 2024 | 757 | 777 | 847 | 832 | ||||||||
| - = No Data Reported; -- = Not Applicable; NA = Not Available; W = Withheld to avoid disclosure of individual company data. |
| Release Date: 6/28/2024 |
| Next Release Date: 7/31/2024 |
Referring Pages: