|
Download Data (XLS File) |
|
||||||||
|
||||||||
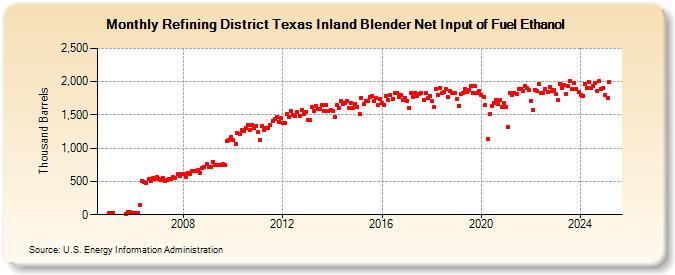
| Refining District Texas Inland Blender Net Input of Fuel Ethanol (Thousand Barrels) | ||||||||
| Year | Jan | Feb | Mar | Apr | May | Jun | Jul | Aug | Sep | Oct | Nov | Dec |
|---|---|---|---|---|---|---|---|---|---|---|---|---|
| 2005 | 32 | 27 | 33 | 14 | 37 | 34 | 27 | |||||
| 2006 | 29 | 26 | 30 | 149 | 505 | 485 | 476 | 532 | 500 | 549 | 534 | 563 |
| 2007 | 539 | 520 | 555 | 506 | 528 | 533 | 534 | 563 | 553 | 605 | 580 | 610 |
| 2008 | 610 | 569 | 620 | 612 | 650 | 650 | 655 | 675 | 629 | 703 | 711 | 763 |
| 2009 | 721 | 714 | 799 | 750 | 753 | 752 | 743 | 762 | 745 | 1,106 | 1,124 | 1,163 |
| 2010 | 1,123 | 1,062 | 1,223 | 1,216 | 1,271 | 1,260 | 1,297 | 1,344 | 1,278 | 1,354 | 1,301 | 1,336 |
| 2011 | 1,246 | 1,128 | 1,334 | 1,279 | 1,308 | 1,309 | 1,345 | 1,410 | 1,432 | 1,470 | 1,398 | 1,450 |
| 2012 | 1,379 | 1,378 | 1,516 | 1,463 | 1,562 | 1,496 | 1,483 | 1,539 | 1,488 | 1,578 | 1,512 | 1,548 |
| 2013 | 1,431 | 1,421 | 1,624 | 1,556 | 1,627 | 1,593 | 1,584 | 1,644 | 1,554 | 1,642 | 1,555 | 1,575 |
| 2014 | 1,563 | 1,470 | 1,647 | 1,609 | 1,703 | 1,657 | 1,686 | 1,702 | 1,605 | 1,684 | 1,610 | 1,671 |
| 2015 | 1,620 | 1,515 | 1,761 | 1,665 | 1,710 | 1,713 | 1,769 | 1,781 | 1,702 | 1,753 | 1,642 | 1,734 |
| 2016 | 1,672 | 1,647 | 1,789 | 1,719 | 1,795 | 1,746 | 1,829 | 1,824 | 1,770 | 1,805 | 1,722 | 1,761 |
| 2017 | 1,715 | 1,611 | 1,829 | 1,767 | 1,834 | 1,782 | 1,821 | 1,830 | 1,722 | 1,832 | 1,751 | 1,783 |
| 2018 | 1,702 | 1,612 | 1,888 | 1,801 | 1,898 | 1,828 | 1,837 | 1,889 | 1,768 | 1,856 | 1,835 | 1,825 |
| 2019 | 1,736 | 1,640 | 1,818 | 1,832 | 1,896 | 1,838 | 1,882 | 1,933 | 1,833 | 1,929 | 1,832 | 1,855 |
| 2020 | 1,797 | 1,776 | 1,652 | 1,144 | 1,508 | 1,637 | 1,682 | 1,731 | 1,657 | 1,723 | 1,616 | 1,681 |
| 2021 | 1,612 | 1,318 | 1,823 | 1,801 | 1,833 | 1,809 | 1,884 | 1,890 | 1,864 | 1,930 | 1,900 | 1,869 |
| 2022 | 1,711 | 1,581 | 1,880 | 1,854 | 1,960 | 1,826 | 1,833 | 1,887 | 1,841 | 1,917 | 1,855 | 1,879 |
| 2023 | 1,808 | 1,711 | 1,964 | 1,913 | 1,953 | 1,829 | 1,931 | 2,005 | 1,893 | 1,980 | 1,875 | 1,834 |
| 2024 | 1,796 | 1,789 | 1,972 | 1,908 | ||||||||
| - = No Data Reported; -- = Not Applicable; NA = Not Available; W = Withheld to avoid disclosure of individual company data. |
| Release Date: 6/28/2024 |
| Next Release Date: 7/31/2024 |
Referring Pages: