|
Download Data (XLS File) |
|
||||||||
|
||||||||
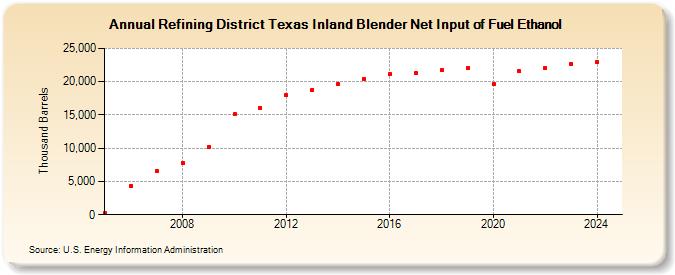
| Refining District Texas Inland Blender Net Input of Fuel Ethanol (Thousand Barrels) | ||||||||
| Decade | Year-0 | Year-1 | Year-2 | Year-3 | Year-4 | Year-5 | Year-6 | Year-7 | Year-8 | Year-9 |
|---|---|---|---|---|---|---|---|---|---|---|
| 2000's | 204 | 4,378 | 6,626 | 7,847 | 10,132 | |||||
| 2010's | 15,065 | 16,109 | 17,942 | 18,806 | 19,607 | 20,365 | 21,079 | 21,277 | 21,739 | 22,024 |
| 2020's | 19,604 | 21,533 | 22,024 | 22,696 |
| - = No Data Reported; -- = Not Applicable; NA = Not Available; W = Withheld to avoid disclosure of individual company data. |
| Release Date: 3/29/2024 |
| Next Release Date: 8/30/2024 |
Referring Pages: