|
Download Data (XLS File) |
|
||||||||
|
||||||||
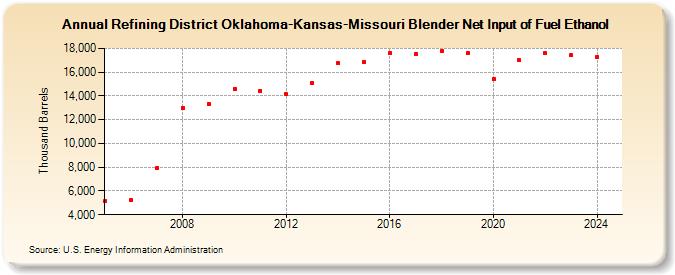
| Refining District Oklahoma-Kansas-Missouri Blender Net Input of Fuel Ethanol (Thousand Barrels) | ||||||||
| Decade | Year-0 | Year-1 | Year-2 | Year-3 | Year-4 | Year-5 | Year-6 | Year-7 | Year-8 | Year-9 |
|---|---|---|---|---|---|---|---|---|---|---|
| 2000's | 5,139 | 5,226 | 7,909 | 12,986 | 13,354 | |||||
| 2010's | 14,599 | 14,450 | 14,156 | 15,067 | 16,736 | 16,866 | 17,608 | 17,536 | 17,821 | 17,592 |
| 2020's | 15,417 | 16,981 | 17,584 | 17,405 |
| - = No Data Reported; -- = Not Applicable; NA = Not Available; W = Withheld to avoid disclosure of individual company data. |
| Release Date: 3/29/2024 |
| Next Release Date: 8/30/2024 |