|
Download Data (XLS File) |
|
||||||||
|
||||||||
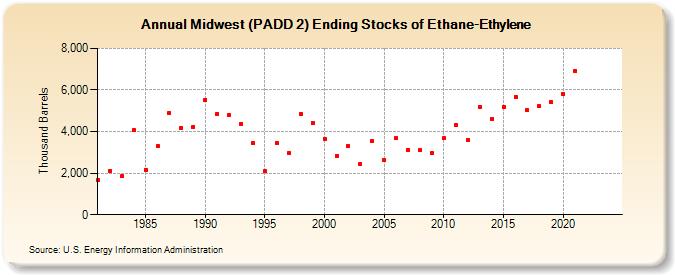
| Midwest (PADD 2) Ending Stocks of Ethane-Ethylene (Thousand Barrels) | ||||||||
| Decade | Year-0 | Year-1 | Year-2 | Year-3 | Year-4 | Year-5 | Year-6 | Year-7 | Year-8 | Year-9 |
|---|---|---|---|---|---|---|---|---|---|---|
| 1980's | 1,657 | 2,109 | 1,862 | 4,072 | 2,164 | 3,312 | 4,897 | 4,192 | 4,231 | |
| 1990's | 5,530 | 4,852 | 4,812 | 4,384 | 3,463 | 2,085 | 3,469 | 2,978 | 4,844 | 4,434 |
| 2000's | 3,646 | 2,847 | 3,314 | 2,435 | 3,551 | 2,622 | 3,670 | 3,130 | 3,099 | 2,970 |
| 2010's | 3,669 | 4,306 | 3,590 | 5,202 | 4,625 | 5,182 | 5,681 | 5,033 | 5,211 | 5,415 |
| 2020's | 5,815 | 6,933 | -- | -- |
| - = No Data Reported; -- = Not Applicable; NA = Not Available; W = Withheld to avoid disclosure of individual company data. |
| Release Date: 8/30/2024 |
| Next Release Date: 8/29/2025 |