|
Download Data (XLS File) |
|
||||||||
|
||||||||
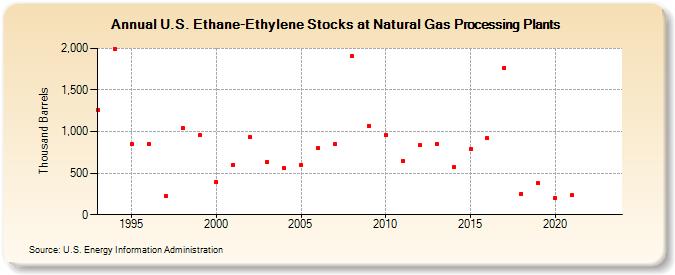
| U.S. Ethane-Ethylene Stocks at Natural Gas Processing Plants (Thousand Barrels) | ||||||||
| Decade | Year-0 | Year-1 | Year-2 | Year-3 | Year-4 | Year-5 | Year-6 | Year-7 | Year-8 | Year-9 |
|---|---|---|---|---|---|---|---|---|---|---|
| 1990's | 1,263 | 1,990 | 850 | 852 | 226 | 1,042 | 954 | |||
| 2000's | 391 | 602 | 933 | 638 | 561 | 600 | 801 | 851 | 1,906 | 1,071 |
| 2010's | 956 | 647 | 837 | 856 | 572 | 785 | 922 | 1,768 | 253 | 381 |
| 2020's | 203 | 233 | -- | -- |
| - = No Data Reported; -- = Not Applicable; NA = Not Available; W = Withheld to avoid disclosure of individual company data. |
| Release Date: 3/29/2024 |
| Next Release Date: 8/30/2024 |