|
Download Data (XLS File) |
|
||||||||
|
||||||||
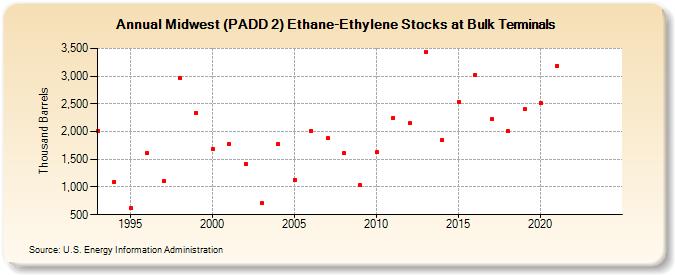
| Midwest (PADD 2) Ethane-Ethylene Stocks at Bulk Terminals (Thousand Barrels) | ||||||||
| Decade | Year-0 | Year-1 | Year-2 | Year-3 | Year-4 | Year-5 | Year-6 | Year-7 | Year-8 | Year-9 |
|---|---|---|---|---|---|---|---|---|---|---|
| 1990's | 2,010 | 1,098 | 613 | 1,607 | 1,106 | 2,961 | 2,342 | |||
| 2000's | 1,687 | 1,783 | 1,420 | 707 | 1,776 | 1,130 | 2,018 | 1,878 | 1,605 | 1,031 |
| 2010's | 1,625 | 2,251 | 2,147 | 3,440 | 1,851 | 2,537 | 3,029 | 2,219 | 2,002 | 2,398 |
| 2020's | 2,506 | 3,189 | -- | -- |
| - = No Data Reported; -- = Not Applicable; NA = Not Available; W = Withheld to avoid disclosure of individual company data. |
| Release Date: 3/29/2024 |
| Next Release Date: 8/30/2024 |