|
Download Data (XLS File) |
|
||||||||
|
||||||||
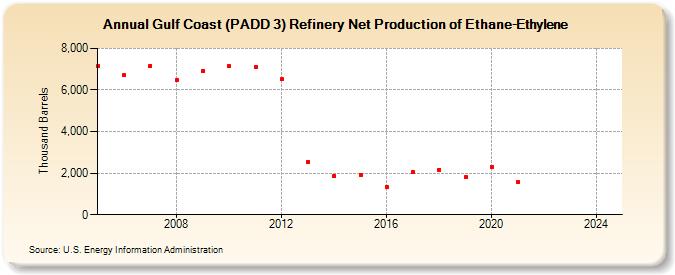
| Gulf Coast (PADD 3) Refinery Net Production of Ethane-Ethylene (Thousand Barrels) | ||||||||
| Decade | Year-0 | Year-1 | Year-2 | Year-3 | Year-4 | Year-5 | Year-6 | Year-7 | Year-8 | Year-9 |
|---|---|---|---|---|---|---|---|---|---|---|
| 2000's | 7,158 | 6,699 | 7,172 | 6,485 | 6,901 | |||||
| 2010's | 7,133 | 7,104 | 6,504 | 2,557 | 1,884 | 1,932 | 1,325 | 2,045 | 2,167 | 1,806 |
| 2020's | 2,314 | 1,574 | -- | -- |
| - = No Data Reported; -- = Not Applicable; NA = Not Available; W = Withheld to avoid disclosure of individual company data. |
| Release Date: 8/30/2024 |
| Next Release Date: 8/29/2025 |
Referring Pages: