|
Download Data (XLS File) |
|
||||||||
|
||||||||
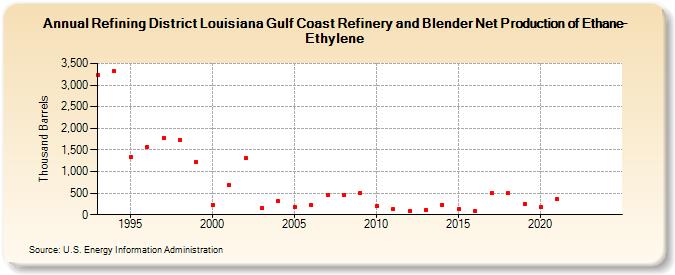
| Refining District Louisiana Gulf Coast Refinery and Blender Net Production of Ethane-Ethylene (Thousand Barrels) | ||||||||
| Decade | Year-0 | Year-1 | Year-2 | Year-3 | Year-4 | Year-5 | Year-6 | Year-7 | Year-8 | Year-9 |
|---|---|---|---|---|---|---|---|---|---|---|
| 1990's | 3,231 | 3,321 | 1,338 | 1,572 | 1,784 | 1,735 | 1,220 | |||
| 2000's | 233 | 677 | 1,312 | 166 | 310 | 185 | 221 | 466 | 458 | 509 |
| 2010's | 196 | 132 | 82 | 114 | 234 | 128 | 82 | 511 | 499 | 259 |
| 2020's | 173 | 361 | -- | -- |
| - = No Data Reported; -- = Not Applicable; NA = Not Available; W = Withheld to avoid disclosure of individual company data. |
| Release Date: 8/30/2024 |
| Next Release Date: 8/29/2025 |