|
Download Data (XLS File) |
|
||||||||
|
||||||||
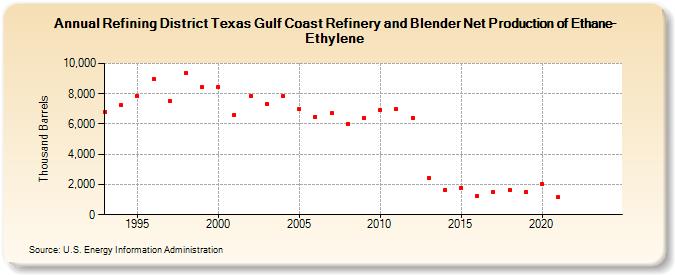
| Refining District Texas Gulf Coast Refinery and Blender Net Production of Ethane-Ethylene (Thousand Barrels) | ||||||||
| Decade | Year-0 | Year-1 | Year-2 | Year-3 | Year-4 | Year-5 | Year-6 | Year-7 | Year-8 | Year-9 |
|---|---|---|---|---|---|---|---|---|---|---|
| 1990's | 6,820 | 7,246 | 7,825 | 8,967 | 7,506 | 9,378 | 8,431 | |||
| 2000's | 8,413 | 6,614 | 7,857 | 7,346 | 7,834 | 6,973 | 6,480 | 6,706 | 6,027 | 6,392 |
| 2010's | 6,937 | 6,972 | 6,422 | 2,443 | 1,649 | 1,789 | 1,229 | 1,519 | 1,652 | 1,505 |
| 2020's | 2,005 | 1,154 | -- | -- |
| - = No Data Reported; -- = Not Applicable; NA = Not Available; W = Withheld to avoid disclosure of individual company data. |
| Release Date: 3/29/2024 |
| Next Release Date: 8/30/2024 |