|
Download Data (XLS File) |
|
||||||||
|
||||||||
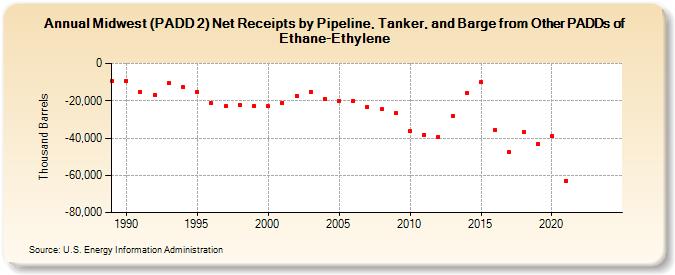
| Midwest (PADD 2) Net Receipts by Pipeline, Tanker, and Barge from Other PADDs of Ethane-Ethylene (Thousand Barrels) | ||||||||
| Decade | Year-0 | Year-1 | Year-2 | Year-3 | Year-4 | Year-5 | Year-6 | Year-7 | Year-8 | Year-9 |
|---|---|---|---|---|---|---|---|---|---|---|
| 1980's | -9,581 | |||||||||
| 1990's | -9,264 | -15,167 | -16,705 | -10,565 | -12,675 | -15,145 | -21,372 | -23,040 | -22,122 | -22,625 |
| 2000's | -23,036 | -21,268 | -17,274 | -15,153 | -18,984 | -20,104 | -19,944 | -23,469 | -24,587 | -26,676 |
| 2010's | -36,249 | -38,378 | -39,435 | -28,103 | -15,813 | -9,980 | -35,500 | -47,753 | -37,014 | -42,983 |
| 2020's | -39,095 | -62,903 | -- | -- |
| - = No Data Reported; -- = Not Applicable; NA = Not Available; W = Withheld to avoid disclosure of individual company data. |
| Release Date: 6/28/2024 |
| Next Release Date: 8/30/2024 |