|
Download Data (XLS File) |
|
||||||||
|
||||||||
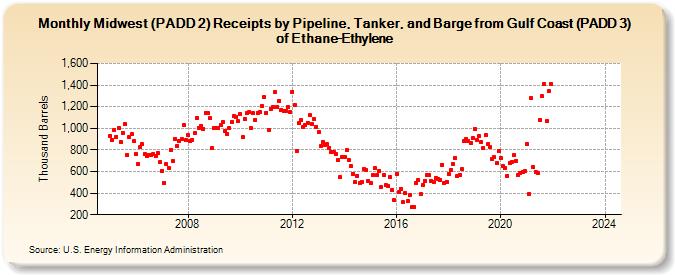
| Midwest (PADD 2) Receipts by Pipeline, Tanker, and Barge from Gulf Coast (PADD 3) of Ethane-Ethylene (Thousand Barrels) | ||||||||
| Year | Jan | Feb | Mar | Apr | May | Jun | Jul | Aug | Sep | Oct | Nov | Dec |
|---|---|---|---|---|---|---|---|---|---|---|---|---|
| 2005 | 930 | 893 | 987 | 922 | 1,001 | 875 | 961 | 1,037 | 751 | 924 | 945 | 880 |
| 2006 | 764 | 673 | 823 | 852 | 761 | 739 | 756 | 752 | 760 | 743 | 773 | 687 |
| 2007 | 605 | 496 | 665 | 636 | 802 | 697 | 904 | 840 | 885 | 897 | 1,027 | 891 |
| 2008 | 935 | 880 | 892 | 960 | 1,098 | 1,007 | 1,023 | 998 | 1,143 | 1,144 | 1,091 | 816 |
| 2009 | 1,006 | 1,006 | 1,005 | 1,035 | 1,059 | 976 | 951 | 1,004 | 1,062 | 1,110 | 1,103 | 1,063 |
| 2010 | 1,133 | 915 | 1,086 | 1,139 | 1,150 | 999 | 1,141 | 1,077 | 1,144 | 1,147 | 1,207 | 1,286 |
| 2011 | 1,144 | 982 | 1,180 | 1,201 | 1,332 | 1,198 | 1,252 | 1,172 | 1,163 | 1,163 | 1,199 | 1,155 |
| 2012 | 1,340 | 1,214 | 791 | 1,048 | 1,076 | 1,015 | 1,026 | 1,052 | 1,120 | 1,042 | 1,084 | 1,015 |
| 2013 | 962 | 838 | 871 | 845 | 852 | 820 | 778 | 780 | 763 | 705 | 549 | 734 |
| 2014 | 732 | 798 | 706 | 648 | 581 | 501 | 561 | 489 | 505 | 625 | 613 | 509 |
| 2015 | 497 | 568 | 628 | 569 | 608 | 455 | 566 | 473 | 467 | 548 | 428 | 334 |
| 2016 | 579 | 410 | 442 | 314 | 397 | 324 | 379 | 269 | 267 | 493 | 523 | 389 |
| 2017 | 477 | 514 | 567 | 565 | 513 | 502 | 543 | 533 | 523 | 663 | 496 | 504 |
| 2018 | 581 | 615 | 669 | 726 | 558 | 571 | 620 | 879 | 900 | 883 | 866 | 909 |
| 2019 | 993 | 888 | 928 | 872 | 813 | 939 | 853 | 830 | 714 | 731 | 675 | 794 |
| 2020 | 724 | 647 | 628 | 560 | 680 | 691 | 750 | 701 | 571 | 588 | 597 | 603 |
| 2021 | 854 | 391 | 1,277 | 638 | 596 | 582 | 1,080 | 1,296 | 1,411 | 1,065 | 1,342 | 1,412 |
| 2022 | -- | -- | -- | -- | -- | -- | -- | -- | -- | -- | -- | -- |
| 2023 | -- | -- | -- | -- | -- | -- | -- | -- | -- | -- | -- | -- |
| 2024 | -- | |||||||||||
| - = No Data Reported; -- = Not Applicable; NA = Not Available; W = Withheld to avoid disclosure of individual company data. |
| Release Date: 3/29/2024 |
| Next Release Date: 4/30/2024 |