|
Download Data (XLS File) |
|
||||||||
|
||||||||
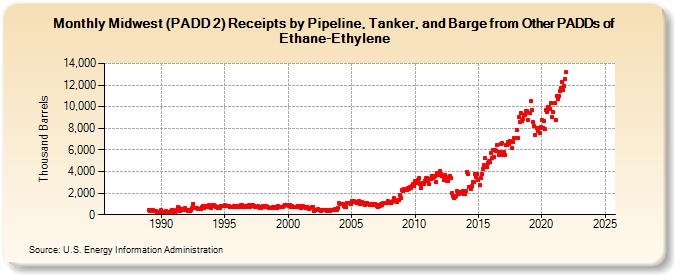
| Midwest (PADD 2) Receipts by Pipeline, Tanker, and Barge from Other PADDs of Ethane-Ethylene (Thousand Barrels) | ||||||||
| Year | Jan | Feb | Mar | Apr | May | Jun | Jul | Aug | Sep | Oct | Nov | Dec |
|---|---|---|---|---|---|---|---|---|---|---|---|---|
| 1986 | -- | -- | -- | -- | -- | -- | -- | -- | -- | -- | -- | -- |
| 1987 | -- | -- | -- | -- | -- | -- | -- | -- | -- | -- | -- | -- |
| 1988 | -- | -- | -- | -- | -- | -- | -- | -- | -- | -- | -- | -- |
| 1989 | 405 | 353 | 414 | 347 | 405 | 363 | 322 | 351 | 282 | 294 | 275 | 213 |
| 1990 | 459 | 235 | 292 | 268 | 352 | 273 | 296 | 256 | 285 | 328 | 436 | 396 |
| 1991 | 211 | 210 | 306 | 405 | 707 | 624 | 370 | 496 | 425 | 508 | 595 | 433 |
| 1992 | 414 | 300 | 435 | 312 | 477 | 632 | 1,028 | 644 | 582 | 658 | 581 | 485 |
| 1993 | 537 | 522 | 670 | 789 | 616 | 770 | 837 | 722 | 755 | 861 | 749 | 621 |
| 1994 | 812 | 943 | 858 | 831 | 733 | 749 | 655 | 658 | 811 | 824 | 791 | 842 |
| 1995 | 858 | 814 | 799 | 812 | 803 | 683 | 722 | 745 | 731 | 776 | 791 | 750 |
| 1996 | 801 | 718 | 832 | 865 | 867 | 744 | 778 | 781 | 714 | 782 | 823 | 905 |
| 1997 | 735 | 765 | 884 | 865 | 823 | 704 | 700 | 769 | 699 | 646 | 656 | 743 |
| 1998 | 773 | 722 | 803 | 785 | 734 | 674 | 629 | 616 | 605 | 598 | 694 | 670 |
| 1999 | 654 | 594 | 762 | 746 | 687 | 745 | 748 | 742 | 769 | 928 | 855 | 868 |
| 2000 | 876 | 823 | 888 | 756 | 796 | 688 | 738 | 741 | 733 | 847 | 771 | 764 |
| 2001 | 591 | 685 | 783 | 718 | 747 | 658 | 695 | 638 | 532 | 615 | 679 | 740 |
| 2002 | 368 | 404 | 456 | 410 | 511 | 400 | 393 | 372 | 417 | 478 | 426 | 435 |
| 2003 | 472 | 370 | 445 | 435 | 389 | 391 | 417 | 445 | 491 | 397 | 468 | 622 |
| 2004 | 1,095 | 997 | 959 | 998 | 989 | 795 | 705 | 756 | 1,066 | 1,127 | 1,107 | 1,033 |
| 2005 | 1,231 | 1,161 | 1,257 | 1,142 | 1,217 | 1,077 | 1,180 | 1,267 | 962 | 1,153 | 1,163 | 1,084 |
| 2006 | 1,005 | 881 | 1,063 | 1,075 | 978 | 920 | 965 | 967 | 942 | 971 | 1,008 | 922 |
| 2007 | 810 | 724 | 899 | 840 | 996 | 857 | 1,064 | 1,049 | 1,099 | 1,119 | 1,248 | 1,117 |
| 2008 | 1,151 | 1,106 | 1,147 | 1,244 | 1,556 | 1,304 | 1,239 | 1,205 | 1,376 | 1,346 | 1,868 | 1,545 |
| 2009 | 2,314 | 2,202 | 2,343 | 2,301 | 2,327 | 2,461 | 2,399 | 2,524 | 2,507 | 2,637 | 2,847 | 2,627 |
| 2010 | 3,128 | 3,066 | 2,971 | 3,200 | 3,377 | 2,806 | 2,514 | 2,898 | 2,860 | 3,142 | 3,364 | 3,410 |
| 2011 | 3,127 | 2,843 | 3,317 | 3,297 | 3,621 | 3,363 | 3,463 | 3,585 | 3,016 | 3,833 | 3,786 | 3,689 |
| 2012 | 4,068 | 3,754 | 3,575 | 3,200 | 3,649 | 3,304 | 3,139 | 3,144 | 3,488 | 3,546 | 3,369 | 2,046 |
| 2013 | 1,747 | 1,546 | 1,661 | 1,728 | 2,173 | 1,903 | 1,926 | 2,145 | 2,056 | 2,150 | 1,902 | 1,957 |
| 2014 | 2,157 | 3,969 | 3,751 | 2,593 | 2,578 | 2,336 | 2,632 | 3,008 | 3,024 | 3,731 | 3,491 | 3,811 |
| 2015 | 3,177 | 2,737 | 3,419 | 3,744 | 4,270 | 4,566 | 5,220 | 4,503 | 4,435 | 4,808 | 4,928 | 4,860 |
| 2016 | 5,745 | 5,296 | 5,950 | 5,302 | 6,027 | 5,938 | 6,467 | 5,553 | 5,834 | 6,536 | 6,629 | 5,526 |
| 2017 | 5,768 | 5,489 | 6,483 | 6,434 | 6,765 | 6,523 | 6,797 | 6,701 | 6,222 | 6,747 | 7,105 | 7,120 |
| 2018 | 7,860 | 7,060 | 9,050 | 8,608 | 9,434 | 8,709 | 8,841 | 9,243 | 9,185 | 9,637 | 9,613 | 8,799 |
| 2019 | 9,384 | 9,379 | 10,546 | 9,680 | 8,564 | 8,185 | 7,402 | 7,982 | 7,767 | 8,048 | 7,590 | 8,090 |
| 2020 | 8,750 | 8,050 | 8,702 | 7,920 | 9,724 | 9,500 | 9,961 | 10,003 | 9,772 | 10,363 | 9,059 | 9,470 |
| 2021 | 10,333 | 8,771 | 10,995 | 10,667 | 10,946 | 11,471 | 11,765 | 12,282 | 11,533 | 11,874 | 12,579 | 13,206 |
| 2022 | -- | -- | -- | -- | -- | -- | -- | -- | -- | -- | -- | -- |
| 2023 | -- | -- | -- | -- | -- | -- | -- | -- | -- | -- | -- | -- |
| 2024 | -- | |||||||||||
| - = No Data Reported; -- = Not Applicable; NA = Not Available; W = Withheld to avoid disclosure of individual company data. |
| Release Date: 3/29/2024 |
| Next Release Date: 4/30/2024 |