|
Download Data (XLS File) |
|
||||||||
|
||||||||
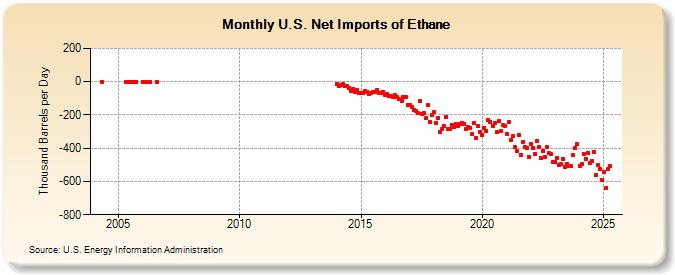
| U.S. Net Imports of Ethane (Thousand Barrels per Day) | ||||||||
| Year | Jan | Feb | Mar | Apr | May | Jun | Jul | Aug | Sep | Oct | Nov | Dec |
|---|---|---|---|---|---|---|---|---|---|---|---|---|
| 2004 | 0 | |||||||||||
| 2005 | 0 | 0 | 0 | 0 | 0 | 0 | ||||||
| 2006 | 0 | 0 | 0 | 0 | ||||||||
| 2007 | 1 | |||||||||||
| 2014 | -14 | -24 | -21 | -17 | -29 | -24 | -39 | -57 | -46 | -63 | -49 | -70 |
| 2015 | -67 | -71 | -55 | -62 | -77 | -70 | -65 | -60 | -51 | -68 | -66 | -63 |
| 2016 | -83 | -76 | -85 | -86 | -92 | -81 | -91 | -105 | -116 | -91 | -91 | -139 |
| 2017 | -138 | -153 | -170 | -176 | -191 | -119 | -192 | -188 | -221 | -139 | -244 | -201 |
| 2018 | -185 | -246 | -217 | -303 | -284 | -268 | -211 | -284 | -285 | -263 | -270 | -257 |
| 2019 | -266 | -255 | -246 | -252 | -283 | -275 | -278 | -312 | -246 | -338 | -266 | -301 |
| 2020 | -323 | -277 | -295 | -230 | -241 | -264 | -251 | -303 | -238 | -299 | -260 | -264 |
| 2021 | -316 | -243 | -352 | -329 | -393 | -418 | -319 | -442 | -364 | -393 | -399 | -453 |
| 2022 | -375 | -400 | -434 | -354 | -394 | -460 | -415 | -450 | -391 | -431 | -437 | -483 |
| 2023 | -481 | -474 | -537 | -490 | -463 | -513 | -477 | -508 | -504 | -435 | -400 | -365 |
| 2024 | -505 | -497 | -434 | -465 | ||||||||
| - = No Data Reported; -- = Not Applicable; NA = Not Available; W = Withheld to avoid disclosure of individual company data. |
| Release Date: 6/28/2024 |
| Next Release Date: 7/31/2024 |