|
Download Data (XLS File) |
|
||||||||
|
||||||||
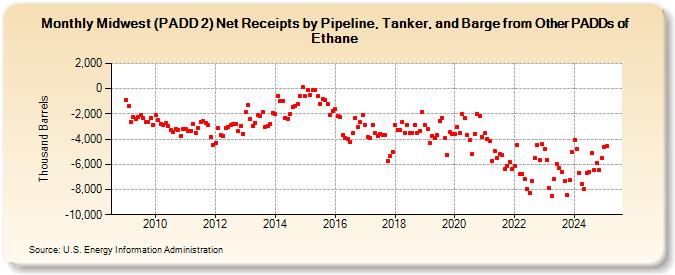
| Midwest (PADD 2) Net Receipts by Pipeline, Tanker, and Barge from Other PADDs of Ethane (Thousand Barrels) | ||||||||
| Year | Jan | Feb | Mar | Apr | May | Jun | Jul | Aug | Sep | Oct | Nov | Dec |
|---|---|---|---|---|---|---|---|---|---|---|---|---|
| 2009 | -881 | -1,363 | -2,637 | -2,210 | -2,417 | -2,234 | -2,112 | -2,334 | -2,679 | -2,614 | -2,305 | -2,890 |
| 2010 | -2,120 | -2,488 | -2,809 | -2,869 | -2,761 | -2,975 | -3,299 | -3,444 | -3,192 | -3,281 | -3,785 | -3,226 |
| 2011 | -3,215 | -3,331 | -3,321 | -2,800 | -3,486 | -3,097 | -2,655 | -2,565 | -2,735 | -2,900 | -3,812 | -4,461 |
| 2012 | -4,287 | -3,104 | -3,638 | -3,761 | -3,128 | -3,066 | -2,901 | -2,796 | -2,798 | -3,391 | -2,963 | -3,602 |
| 2013 | -1,871 | -1,322 | -2,389 | -2,983 | -2,686 | -2,118 | -2,186 | -1,888 | -3,013 | -2,953 | -2,791 | -1,903 |
| 2014 | -2,037 | -554 | -979 | -958 | -2,314 | -2,417 | -1,992 | -1,430 | -1,390 | -1,251 | -599 | 108 |
| 2015 | -617 | -98 | -537 | -108 | -115 | -569 | -1,227 | -794 | -895 | -1,226 | -2,050 | -1,744 |
| 2016 | -1,647 | -2,169 | -2,238 | -3,677 | -3,891 | -3,989 | -4,237 | -3,515 | -2,331 | -3,049 | -2,665 | -2,092 |
| 2017 | -2,868 | -3,853 | -3,929 | -2,853 | -3,489 | -3,745 | -3,569 | -3,692 | -3,680 | -5,728 | -5,346 | -5,001 |
| 2018 | -2,879 | -3,301 | -3,273 | -2,645 | -3,487 | -2,843 | -3,505 | -3,514 | -2,890 | -3,508 | -3,321 | -1,848 |
| 2019 | -2,883 | -3,231 | -4,347 | -3,723 | -3,947 | -3,713 | -2,529 | -2,364 | -3,925 | -5,298 | -3,464 | -3,559 |
| 2020 | -3,623 | -3,012 | -3,554 | -2,017 | -2,342 | -3,695 | -4,095 | -5,167 | -3,600 | -1,990 | -2,181 | -3,819 |
| 2021 | -3,542 | -3,981 | -4,126 | -5,716 | -4,911 | -5,495 | -5,180 | -5,260 | -6,395 | -6,119 | -5,815 | -6,363 |
| 2022 | -6,115 | -4,466 | -6,750 | -6,786 | -7,164 | -7,992 | -8,238 | -7,321 | -5,538 | -4,455 | -5,674 | -4,428 |
| 2023 | -4,817 | -5,691 | -7,882 | -8,502 | -7,149 | -6,009 | -6,306 | -6,630 | -7,361 | -8,400 | -7,274 | -5,036 |
| 2024 | -4,073 | |||||||||||
| - = No Data Reported; -- = Not Applicable; NA = Not Available; W = Withheld to avoid disclosure of individual company data. |
| Release Date: 3/29/2024 |
| Next Release Date: 4/30/2024 |