|
Download Data (XLS File) |
|
||||||||
|
||||||||
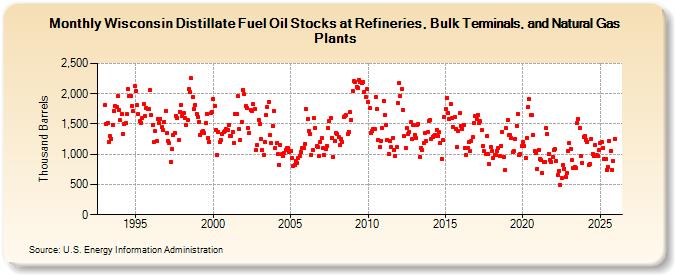
| Wisconsin Distillate Fuel Oil Stocks at Refineries, Bulk Terminals, and Natural Gas Plants (Thousand Barrels) | ||||||||
| Year | Jan | Feb | Mar | Apr | May | Jun | Jul | Aug | Sep | Oct | Nov | Dec |
|---|---|---|---|---|---|---|---|---|---|---|---|---|
| 1993 | 1,815 | 1,504 | 1,517 | 1,210 | 1,293 | 1,259 | 1,487 | 1,717 | 1,795 | 1,779 | 1,966 | 1,733 |
| 1994 | 1,559 | 1,672 | 1,333 | 1,498 | 1,510 | 1,660 | 2,071 | 1,970 | 1,965 | 1,795 | 1,710 | 2,122 |
| 1995 | 2,047 | 1,811 | 1,657 | 1,541 | 1,522 | 1,607 | 1,828 | 1,636 | 1,765 | 1,743 | 1,746 | 2,058 |
| 1996 | 1,645 | 1,478 | 1,203 | 1,380 | 1,216 | 1,587 | 1,512 | 1,590 | 1,449 | 1,400 | 1,534 | 1,721 |
| 1997 | 1,354 | 1,225 | 1,180 | 877 | 1,093 | 1,311 | 1,358 | 1,637 | 1,600 | 1,238 | 1,704 | 1,815 |
| 1998 | 1,630 | 1,681 | 1,598 | 1,480 | 1,563 | 2,075 | 2,023 | 2,253 | 1,944 | 1,740 | 1,811 | 1,673 |
| 1999 | 1,622 | 1,538 | 1,312 | 1,367 | 1,381 | 1,352 | 1,517 | 1,668 | 1,265 | 1,201 | 1,681 | 1,704 |
| 2000 | 1,914 | 1,802 | 1,407 | 994 | 1,372 | 1,196 | 1,239 | 1,333 | 1,369 | 1,389 | 1,421 | 1,405 |
| 2001 | 1,480 | 1,295 | 1,303 | 1,374 | 1,191 | 1,665 | 1,665 | 1,962 | 1,415 | 1,237 | 1,539 | 2,067 |
| 2002 | 1,991 | 1,801 | 1,760 | 1,426 | 1,358 | 1,734 | 1,710 | 1,825 | 1,752 | 1,065 | 1,151 | 1,570 |
| 2003 | 1,496 | 1,246 | 1,066 | 994 | 1,204 | 1,648 | 1,783 | 1,870 | 1,315 | 1,178 | 1,465 | 1,717 |
| 2004 | 1,106 | 1,181 | 1,002 | 827 | 1,153 | 998 | 963 | 1,028 | 1,064 | 1,104 | 1,103 | 1,039 |
| 2005 | 1,057 | 934 | 801 | 825 | 887 | 854 | 941 | 977 | 1,029 | 1,097 | 1,104 | 1,176 |
| 2006 | 1,747 | 1,580 | 1,392 | 1,341 | 990 | 1,062 | 1,595 | 1,441 | 1,138 | 1,114 | 971 | 1,206 |
| 2007 | 1,261 | 1,095 | 989 | 1,081 | 1,137 | 1,439 | 1,557 | 1,596 | 1,275 | 952 | 1,215 | 1,350 |
| 2008 | 1,331 | 1,277 | 1,145 | 1,248 | 1,200 | 1,619 | 1,627 | 1,646 | 1,339 | 1,373 | 1,693 | 1,573 |
| 2009 | 2,053 | 2,207 | 2,197 | 2,111 | 2,102 | 2,232 | 2,196 | 2,172 | 2,200 | 2,032 | 1,947 | 2,072 |
| 2010 | 1,868 | 1,757 | 1,345 | 1,377 | 1,412 | 1,409 | 1,949 | 1,745 | 1,243 | 1,124 | 1,225 | 1,439 |
| 2011 | 1,884 | 1,650 | 1,484 | 1,231 | 1,008 | 1,213 | 1,114 | 1,270 | 1,065 | 967 | 1,112 | 1,845 |
| 2012 | 2,175 | 1,969 | 2,081 | 1,735 | 1,297 | 1,111 | 1,429 | 1,333 | 1,373 | 1,527 | 1,251 | 1,480 |
| 2013 | 1,318 | 1,267 | 1,491 | 1,506 | 959 | 1,107 | 1,072 | 1,183 | 1,359 | 1,223 | 1,363 | 1,547 |
| 2014 | 1,573 | 1,257 | 1,292 | 1,309 | 1,325 | 1,408 | 1,304 | 1,363 | 1,179 | 926 | 1,227 | 1,617 |
| 2015 | 1,751 | 1,933 | 1,682 | 1,576 | 1,828 | 1,601 | 1,444 | 1,613 | 1,423 | 1,119 | 1,386 | 1,682 |
| 2016 | 1,468 | 1,425 | 1,477 | 1,109 | 992 | 1,101 | 1,196 | 1,047 | 1,225 | 1,283 | 1,513 | 1,638 |
| 2017 | 1,583 | 1,656 | 1,519 | 1,544 | 1,403 | 1,133 | 1,045 | 1,007 | 1,305 | 997 | 834 | 1,120 |
| 2018 | 1,051 | 943 | 991 | 989 | 1,054 | 1,100 | 976 | 1,142 | 1,371 | 958 | 739 | 1,431 |
| 2019 | 1,567 | 1,318 | 1,311 | 1,261 | 1,029 | 1,046 | 1,255 | 1,471 | 1,670 | 982 | 1,007 | 1,140 |
| 2020 | 1,204 | 1,132 | 931 | 1,276 | 1,778 | 1,908 | 1,648 | 1,641 | 1,323 | 1,057 | 1,023 | 756 |
| 2021 | 1,075 | 920 | 903 | 687 | 864 | 876 | 1,431 | 1,332 | 1,009 | 911 | 875 | 946 |
| 2022 | 1,074 | 1,080 | 894 | 664 | 726 | 496 | 611 | 825 | 760 | 631 | 694 | 1,048 |
| 2023 | 1,187 | 1,087 | 902 | 773 | 797 | 766 | 1,509 | 1,590 | 1,433 | 965 | 861 | 1,283 |
| 2024 | 1,304 | |||||||||||
| - = No Data Reported; -- = Not Applicable; NA = Not Available; W = Withheld to avoid disclosure of individual company data. |
| Release Date: 3/29/2024 |
| Next Release Date: 4/30/2024 |