|
Download Data (XLS File) |
|
||||||||
|
||||||||
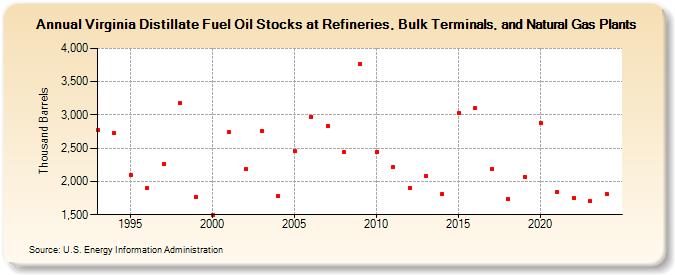
| Virginia Distillate Fuel Oil Stocks at Refineries, Bulk Terminals, and Natural Gas Plants (Thousand Barrels) | ||||||||
| Decade | Year-0 | Year-1 | Year-2 | Year-3 | Year-4 | Year-5 | Year-6 | Year-7 | Year-8 | Year-9 |
|---|---|---|---|---|---|---|---|---|---|---|
| 1990's | 2,767 | 2,725 | 2,101 | 1,896 | 2,267 | 3,172 | 1,769 | |||
| 2000's | 1,502 | 2,736 | 2,184 | 2,762 | 1,778 | 2,451 | 2,975 | 2,836 | 2,438 | 3,763 |
| 2010's | 2,441 | 2,214 | 1,902 | 2,087 | 1,808 | 3,028 | 3,099 | 2,191 | 1,737 | 2,074 |
| 2020's | 2,878 | 1,843 | 1,758 | 1,707 | 1,808 |
| - = No Data Reported; -- = Not Applicable; NA = Not Available; W = Withheld to avoid disclosure of individual company data. |
| Release Date: 6/30/2025 |
| Next Release Date: 8/29/2025 |