|
Download Data (XLS File) |
|
||||||||
|
||||||||
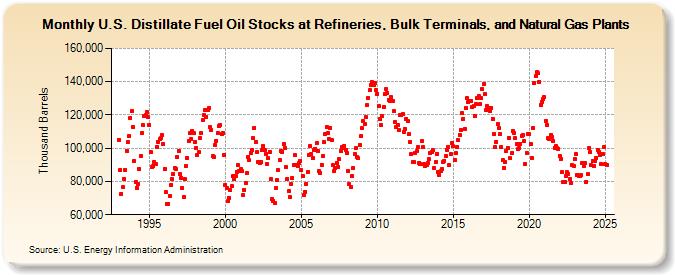
| U.S. Distillate Fuel Oil Stocks at Refineries, Bulk Terminals, and Natural Gas Plants (Thousand Barrels) | ||||||||
| Year | Jan | Feb | Mar | Apr | May | Jun | Jul | Aug | Sep | Oct | Nov | Dec |
|---|---|---|---|---|---|---|---|---|---|---|---|---|
| 1993 | 105,171 | 87,078 | 72,734 | 76,419 | 81,540 | 87,008 | 98,276 | 103,814 | 107,261 | 118,385 | 122,148 | 112,931 |
| 1994 | 92,397 | 79,526 | 76,158 | 78,382 | 87,766 | 95,571 | 108,997 | 113,641 | 119,293 | 119,947 | 121,882 | 118,474 |
| 1995 | 113,982 | 97,762 | 88,980 | 89,432 | 91,599 | 90,333 | 100,973 | 103,735 | 105,517 | 106,010 | 107,926 | 102,456 |
| 1996 | 87,638 | 73,405 | 66,681 | 66,485 | 71,284 | 77,986 | 81,209 | 84,709 | 88,191 | 87,749 | 94,648 | 98,505 |
| 1997 | 84,304 | 82,350 | 76,241 | 70,513 | 81,320 | 89,458 | 94,218 | 104,182 | 108,990 | 105,520 | 110,477 | 109,391 |
| 1998 | 103,669 | 99,893 | 95,893 | 97,531 | 106,252 | 108,897 | 116,752 | 120,007 | 122,712 | 118,886 | 122,709 | 124,137 |
| 1999 | 112,768 | 111,213 | 95,125 | 94,810 | 102,087 | 104,538 | 109,173 | 113,632 | 113,990 | 108,622 | 109,171 | 95,830 |
| 2000 | 78,130 | 76,139 | 68,046 | 70,217 | 74,729 | 77,260 | 83,051 | 81,318 | 83,428 | 85,927 | 89,683 | 86,238 |
| 2001 | 87,304 | 86,093 | 72,100 | 75,032 | 79,291 | 85,056 | 94,983 | 92,744 | 97,213 | 98,614 | 106,088 | 112,363 |
| 2002 | 103,932 | 97,433 | 91,963 | 91,206 | 91,752 | 99,014 | 101,363 | 98,707 | 96,686 | 90,775 | 93,905 | 97,904 |
| 2003 | 81,403 | 69,721 | 68,501 | 67,331 | 75,765 | 80,853 | 86,700 | 92,724 | 98,489 | 97,967 | 102,613 | 100,226 |
| 2004 | 88,469 | 81,596 | 74,147 | 70,758 | 78,380 | 81,858 | 89,674 | 95,685 | 90,070 | 89,179 | 90,907 | 92,464 |
| 2005 | 86,731 | 83,278 | 71,662 | 73,809 | 78,673 | 85,619 | 95,860 | 101,239 | 96,466 | 94,041 | 98,918 | 99,662 |
| 2006 | 102,901 | 98,238 | 86,114 | 85,360 | 89,970 | 95,104 | 103,662 | 108,793 | 112,824 | 109,190 | 105,242 | 112,042 |
| 2007 | 104,802 | 89,647 | 86,208 | 87,923 | 91,360 | 88,796 | 93,422 | 98,331 | 100,518 | 100,074 | 101,397 | 99,206 |
| 2008 | 97,043 | 86,230 | 78,593 | 76,846 | 83,282 | 88,079 | 96,363 | 99,923 | 94,505 | 93,819 | 101,658 | 107,091 |
| 2009 | 111,908 | 116,173 | 114,390 | 118,468 | 125,945 | 130,178 | 134,746 | 138,212 | 139,555 | 138,218 | 139,195 | 134,815 |
| 2010 | 132,834 | 125,257 | 117,395 | 114,103 | 119,081 | 124,650 | 132,785 | 135,379 | 133,264 | 129,022 | 128,530 | 130,495 |
| 2011 | 128,404 | 122,073 | 115,846 | 112,538 | 114,236 | 110,708 | 119,801 | 119,696 | 120,501 | 109,873 | 111,320 | 117,571 |
| 2012 | 116,101 | 108,449 | 103,848 | 96,430 | 91,406 | 91,581 | 97,213 | 98,293 | 100,535 | 91,262 | 90,401 | 104,069 |
| 2013 | 100,533 | 90,541 | 89,587 | 89,736 | 91,253 | 93,319 | 97,300 | 97,519 | 98,621 | 88,208 | 91,394 | 96,746 |
| 2014 | 85,946 | 83,966 | 86,029 | 87,407 | 91,751 | 92,595 | 95,073 | 98,932 | 100,773 | 89,868 | 96,468 | 102,996 |
| 2015 | 101,035 | 92,975 | 96,903 | 100,809 | 104,888 | 107,949 | 110,933 | 120,895 | 117,700 | 111,543 | 124,356 | 129,962 |
| 2016 | 127,486 | 128,638 | 128,541 | 124,592 | 125,287 | 119,139 | 126,814 | 129,880 | 131,362 | 126,300 | 129,960 | 135,484 |
| 2017 | 138,477 | 132,686 | 122,745 | 125,105 | 123,930 | 122,428 | 124,237 | 117,747 | 108,802 | 100,521 | 103,928 | 114,548 |
| 2018 | 111,885 | 108,298 | 100,449 | 92,734 | 88,297 | 91,609 | 98,386 | 100,226 | 106,373 | 93,859 | 96,913 | 110,101 |
| 2019 | 109,198 | 106,057 | 102,556 | 99,290 | 99,921 | 102,732 | 107,519 | 107,953 | 104,055 | 90,450 | 97,167 | 108,529 |
| 2020 | 108,362 | 102,221 | 94,323 | 112,363 | 139,021 | 143,151 | 145,684 | 145,029 | 140,059 | 126,012 | 127,977 | 129,385 |
| 2021 | 130,555 | 116,349 | 113,906 | 105,912 | 105,379 | 107,985 | 107,006 | 104,435 | 100,309 | 101,195 | 100,149 | 99,771 |
| 2022 | 95,422 | 93,364 | 85,465 | 79,805 | 79,787 | 83,379 | 85,475 | 84,697 | 81,366 | 79,138 | 89,786 | 89,508 |
| 2023 | 93,737 | 96,528 | 84,621 | 83,808 | 83,773 | 84,288 | 91,461 | 89,371 | 91,359 | 80,429 | 84,658 | 99,958 |
| 2024 | 97,606 | |||||||||||
| - = No Data Reported; -- = Not Applicable; NA = Not Available; W = Withheld to avoid disclosure of individual company data. |
| Release Date: 3/29/2024 |
| Next Release Date: 4/30/2024 |