|
Download Data (XLS File) |
|
||||||||
|
||||||||
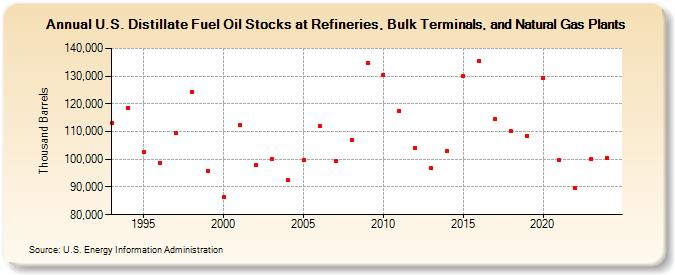
| U.S. Distillate Fuel Oil Stocks at Refineries, Bulk Terminals, and Natural Gas Plants (Thousand Barrels) | ||||||||
| Decade | Year-0 | Year-1 | Year-2 | Year-3 | Year-4 | Year-5 | Year-6 | Year-7 | Year-8 | Year-9 |
|---|---|---|---|---|---|---|---|---|---|---|
| 1990's | 112,931 | 118,474 | 102,456 | 98,505 | 109,391 | 124,137 | 95,830 | |||
| 2000's | 86,238 | 112,363 | 97,904 | 100,226 | 92,464 | 99,662 | 112,042 | 99,206 | 107,091 | 134,815 |
| 2010's | 130,495 | 117,571 | 104,069 | 96,746 | 102,996 | 129,962 | 135,484 | 114,548 | 110,101 | 108,529 |
| 2020's | 129,385 | 99,771 | 89,508 | 99,958 |
| - = No Data Reported; -- = Not Applicable; NA = Not Available; W = Withheld to avoid disclosure of individual company data. |
| Release Date: 6/28/2024 |
| Next Release Date: 8/30/2024 |