|
Download Data (XLS File) |
|
||||||||
|
||||||||
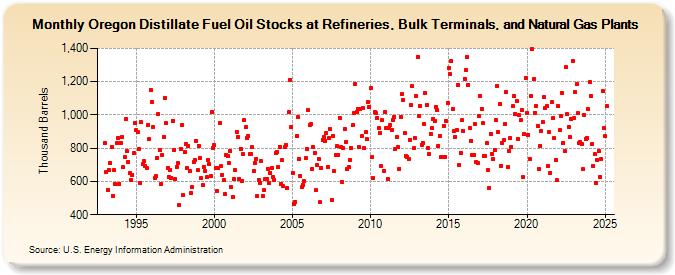
| Oregon Distillate Fuel Oil Stocks at Refineries, Bulk Terminals, and Natural Gas Plants (Thousand Barrels) | ||||||||
| Year | Jan | Feb | Mar | Apr | May | Jun | Jul | Aug | Sep | Oct | Nov | Dec |
|---|---|---|---|---|---|---|---|---|---|---|---|---|
| 1993 | 830 | 655 | 550 | 669 | 711 | 808 | 515 | 669 | 586 | 831 | 864 | 587 |
| 1994 | 834 | 867 | 684 | 749 | 974 | 781 | 719 | 649 | 606 | 638 | 771 | 950 |
| 1995 | 907 | 897 | 797 | 593 | 955 | 702 | 720 | 693 | 683 | 941 | 854 | 1,150 |
| 1996 | 1,080 | 925 | 620 | 630 | 740 | 1,005 | 790 | 586 | 761 | 869 | 1,103 | 950 |
| 1997 | 683 | 628 | 669 | 623 | 966 | 792 | 614 | 686 | 709 | 457 | 797 | 939 |
| 1998 | 521 | 776 | 826 | 678 | 813 | 662 | 530 | 568 | 717 | 730 | 846 | 666 |
| 1999 | 816 | 739 | 619 | 578 | 688 | 661 | 624 | 729 | 704 | 630 | 1,019 | 804 |
| 2000 | 819 | 680 | 541 | 681 | 953 | 691 | 641 | 610 | 527 | 758 | 752 | 711 |
| 2001 | 786 | 564 | 506 | 614 | 668 | 900 | 869 | 615 | 797 | 602 | 763 | 967 |
| 2002 | 925 | 861 | 873 | 764 | 767 | 805 | 664 | 710 | 737 | 511 | 608 | 593 |
| 2003 | 721 | 512 | 546 | 612 | 616 | 677 | 589 | 651 | 683 | 625 | 610 | 772 |
| 2004 | 780 | 685 | 810 | 585 | 727 | 570 | 807 | 822 | 561 | 1,016 | 1,212 | 930 |
| 2005 | 653 | 464 | 477 | 872 | 985 | 734 | 633 | 564 | 581 | 601 | 740 | 794 |
| 2006 | 1,027 | 940 | 946 | 677 | 809 | 773 | 546 | 696 | 735 | 474 | 683 | 852 |
| 2007 | 870 | 846 | 891 | 688 | 860 | 916 | 491 | 873 | 661 | 758 | 813 | 762 |
| 2008 | 984 | 805 | 599 | 801 | 918 | 839 | 673 | 687 | 731 | 802 | 937 | 1,011 |
| 2009 | 1,185 | 1,018 | 1,036 | 805 | 1,036 | 872 | 1,040 | 799 | 897 | 853 | 1,075 | 1,050 |
| 2010 | 1,160 | 745 | 620 | 1,019 | 1,011 | 984 | 920 | 893 | 691 | 967 | 665 | 1,017 |
| 2011 | 923 | 617 | 922 | 938 | 910 | 972 | 989 | 798 | 866 | 807 | 676 | 990 |
| 2012 | 1,127 | 1,092 | 891 | 756 | 749 | 732 | 851 | 1,061 | 1,171 | 801 | 861 | 1,114 |
| 2013 | 1,350 | 994 | 1,056 | 822 | 834 | 947 | 1,130 | 1,059 | 804 | 765 | 888 | 921 |
| 2014 | 978 | 963 | 1,050 | 1,027 | 816 | 874 | 745 | 747 | 935 | 744 | 966 | 1,071 |
| 2015 | 1,281 | 1,246 | 1,323 | 1,038 | 903 | 868 | 908 | 1,180 | 698 | 772 | 968 | 906 |
| 2016 | 1,216 | 1,269 | 1,348 | 1,182 | 920 | 846 | 762 | 759 | 943 | 717 | 713 | 994 |
| 2017 | 1,116 | 1,038 | 950 | 755 | 753 | 829 | 671 | 561 | 886 | 768 | 732 | 790 |
| 2018 | 969 | 1,176 | 900 | 1,067 | 693 | 831 | 847 | 943 | 1,137 | 687 | 783 | 862 |
| 2019 | 807 | 1,051 | 1,113 | 1,006 | 1,081 | 856 | 999 | 967 | 1,031 | 625 | 884 | 1,223 |
| 2020 | 1,012 | 882 | 732 | 1,113 | 1,396 | 1,215 | 1,012 | 1,053 | 934 | 675 | 816 | 906 |
| 2021 | 957 | 1,110 | 1,042 | 1,051 | 693 | 895 | 651 | 1,076 | 981 | 859 | 730 | 606 |
| 2022 | 1,055 | 908 | 991 | 1,133 | 832 | 783 | 1,286 | 1,004 | 928 | 870 | 975 | 1,325 |
| 2023 | 980 | 1,135 | 1,186 | 1,009 | 831 | 838 | 825 | 673 | 997 | 854 | 863 | 1,035 |
| 2024 | 1,197 | 1,115 | 828 | 693 | 763 | 589 | 728 | 783 | 627 | 733 | 1,143 | 922 |
| 2025 | 871 | 1,052 | 995 | 893 | ||||||||
| - = No Data Reported; -- = Not Applicable; NA = Not Available; W = Withheld to avoid disclosure of individual company data. |
| Release Date: 6/30/2025 |
| Next Release Date: 7/31/2025 |