|
Download Data (XLS File) |
|
||||||||
|
||||||||
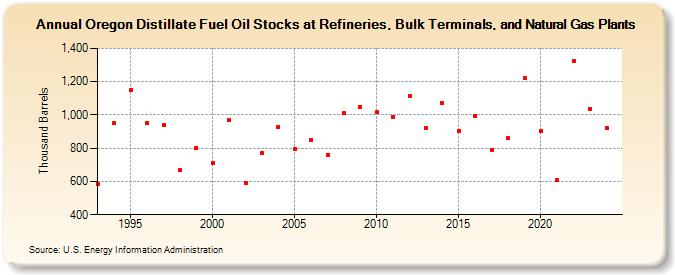
| Oregon Distillate Fuel Oil Stocks at Refineries, Bulk Terminals, and Natural Gas Plants (Thousand Barrels) | ||||||||
| Decade | Year-0 | Year-1 | Year-2 | Year-3 | Year-4 | Year-5 | Year-6 | Year-7 | Year-8 | Year-9 |
|---|---|---|---|---|---|---|---|---|---|---|
| 1990's | 587 | 950 | 1,150 | 950 | 939 | 666 | 804 | |||
| 2000's | 711 | 967 | 593 | 772 | 930 | 794 | 852 | 762 | 1,011 | 1,050 |
| 2010's | 1,017 | 990 | 1,114 | 921 | 1,071 | 906 | 994 | 790 | 862 | 1,223 |
| 2020's | 906 | 606 | 1,325 | 1,035 |
| - = No Data Reported; -- = Not Applicable; NA = Not Available; W = Withheld to avoid disclosure of individual company data. |
| Release Date: 3/29/2024 |
| Next Release Date: 8/30/2024 |