|
Download Data (XLS File) |
|
||||||||
|
||||||||
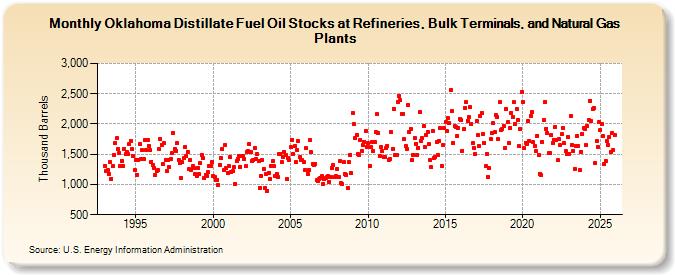
| Oklahoma Distillate Fuel Oil Stocks at Refineries, Bulk Terminals, and Natural Gas Plants (Thousand Barrels) | ||||||||
| Year | Jan | Feb | Mar | Apr | May | Jun | Jul | Aug | Sep | Oct | Nov | Dec |
|---|---|---|---|---|---|---|---|---|---|---|---|---|
| 1993 | 1,313 | 1,219 | 1,232 | 1,178 | 1,365 | 1,093 | 1,299 | 1,492 | 1,686 | 1,768 | 1,594 | 1,525 |
| 1994 | 1,301 | 1,394 | 1,307 | 1,583 | 1,496 | 1,537 | 1,497 | 1,664 | 1,724 | 1,594 | 1,474 | 1,239 |
| 1995 | 1,412 | 1,161 | 1,409 | 1,670 | 1,416 | 1,563 | 1,413 | 1,735 | 1,572 | 1,731 | 1,642 | 1,565 |
| 1996 | 1,377 | 1,325 | 1,277 | 1,159 | 1,228 | 1,238 | 1,582 | 1,750 | 1,657 | 1,337 | 1,679 | 1,410 |
| 1997 | 1,228 | 1,400 | 1,290 | 1,421 | 1,514 | 1,859 | 1,593 | 1,559 | 1,678 | 1,406 | 1,347 | 1,113 |
| 1998 | 1,366 | 1,440 | 1,620 | 1,464 | 1,538 | 1,251 | 1,409 | 1,245 | 1,305 | 1,265 | 1,172 | 1,143 |
| 1999 | 1,279 | 1,167 | 1,349 | 1,495 | 1,435 | 1,111 | 1,161 | 1,143 | 1,198 | 1,311 | 1,311 | 1,378 |
| 2000 | 1,139 | 1,118 | 1,071 | 1,077 | 991 | 1,328 | 1,433 | 1,590 | 1,234 | 1,655 | 1,269 | 1,196 |
| 2001 | 1,301 | 1,453 | 1,207 | 1,215 | 1,282 | 1,010 | 1,384 | 1,427 | 1,476 | 1,291 | 1,466 | 1,473 |
| 2002 | 1,420 | 1,300 | 1,544 | 1,553 | 1,665 | 1,537 | 1,396 | 1,409 | 1,603 | 1,429 | 1,501 | 1,395 |
| 2003 | 945 | 1,145 | 1,406 | 1,256 | 949 | 1,178 | 900 | 1,194 | 1,094 | 1,306 | 1,383 | 1,300 |
| 2004 | 1,137 | 1,180 | 1,128 | 1,505 | 1,508 | 1,370 | 1,457 | 1,541 | 1,491 | 1,092 | 1,441 | 1,398 |
| 2005 | 1,617 | 1,741 | 1,508 | 1,631 | 1,365 | 1,566 | 1,715 | 1,454 | 1,398 | 1,406 | 1,370 | 1,233 |
| 2006 | 1,597 | 1,178 | 1,246 | 1,729 | 1,530 | 1,342 | 1,327 | 1,343 | 1,069 | 1,056 | 1,093 | 1,111 |
| 2007 | 1,139 | 1,010 | 1,096 | 1,107 | 1,129 | 1,134 | 1,049 | 1,127 | 1,278 | 1,318 | 1,125 | 1,134 |
| 2008 | 1,263 | 1,123 | 1,386 | 1,017 | 1,003 | 1,365 | 1,178 | 1,164 | 938 | 1,378 | 1,494 | 1,184 |
| 2009 | 2,187 | 1,994 | 1,772 | 1,817 | 1,501 | 1,494 | 1,742 | 1,554 | 1,645 | 1,707 | 1,888 | 1,623 |
| 2010 | 1,683 | 1,302 | 1,622 | 1,695 | 1,553 | 1,698 | 1,865 | 2,158 | 1,850 | 1,473 | 1,623 | 1,552 |
| 2011 | 1,448 | 1,448 | 1,596 | 1,639 | 1,411 | 1,419 | 1,862 | 1,593 | 2,253 | 1,480 | 1,494 | 2,367 |
| 2012 | 2,467 | 2,391 | 2,171 | 2,170 | 1,749 | 1,634 | 1,582 | 2,317 | 1,865 | 1,920 | 1,405 | 1,495 |
| 2013 | 1,771 | 1,675 | 1,493 | 1,610 | 2,194 | 1,723 | 1,760 | 1,967 | 1,622 | 1,819 | 1,865 | 1,666 |
| 2014 | 1,412 | 1,284 | 1,889 | 1,440 | 1,460 | 1,699 | 1,488 | 1,711 | 1,934 | 1,312 | 1,654 | 1,933 |
| 2015 | 2,032 | 1,876 | 2,091 | 2,014 | 2,559 | 2,210 | 1,691 | 1,962 | 1,943 | 1,807 | 1,935 | 2,080 |
| 2016 | 2,060 | 1,560 | 1,909 | 2,268 | 2,358 | 2,053 | 2,111 | 2,276 | 2,000 | 1,685 | 1,606 | 1,500 |
| 2017 | 2,046 | 1,810 | 1,634 | 2,134 | 2,189 | 1,828 | 1,693 | 1,298 | 1,508 | 1,119 | 1,266 | 1,750 |
| 2018 | 1,851 | 2,011 | 1,863 | 2,149 | 2,116 | 1,751 | 2,357 | 1,896 | 1,914 | 1,970 | 1,602 | 2,251 |
| 2019 | 2,025 | 1,693 | 1,933 | 2,184 | 2,123 | 2,359 | 2,001 | 2,253 | 2,069 | 1,634 | 1,915 | 2,526 |
| 2020 | 2,355 | 1,602 | 1,686 | 1,666 | 2,050 | 1,721 | 2,138 | 2,195 | 1,700 | 1,642 | 1,546 | 1,807 |
| 2021 | 1,490 | 1,180 | 1,156 | 1,703 | 2,064 | 2,364 | 1,922 | 1,849 | 1,515 | 1,516 | 1,817 | 1,693 |
| 2022 | 1,728 | 1,952 | 1,738 | 1,400 | 1,746 | 1,649 | 1,830 | 1,927 | 1,684 | 1,548 | 1,501 | 1,786 |
| 2023 | 1,510 | 2,136 | 1,656 | 1,557 | 1,260 | 1,640 | 1,805 | 1,633 | 1,236 | 1,542 | 1,837 | 1,932 |
| 2024 | 1,916 | |||||||||||
| - = No Data Reported; -- = Not Applicable; NA = Not Available; W = Withheld to avoid disclosure of individual company data. |
| Release Date: 3/29/2024 |
| Next Release Date: 4/30/2024 |