|
Download Data (XLS File) |
|
||||||||
|
||||||||
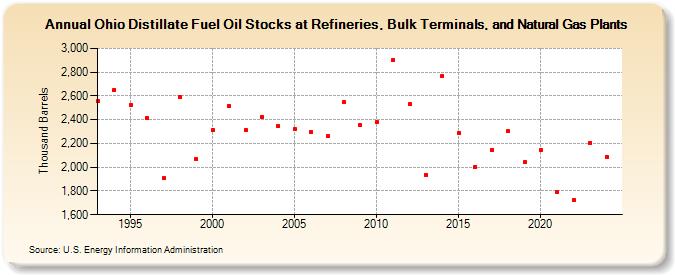
| Ohio Distillate Fuel Oil Stocks at Refineries, Bulk Terminals, and Natural Gas Plants (Thousand Barrels) | ||||||||
| Decade | Year-0 | Year-1 | Year-2 | Year-3 | Year-4 | Year-5 | Year-6 | Year-7 | Year-8 | Year-9 |
|---|---|---|---|---|---|---|---|---|---|---|
| 1990's | 2,556 | 2,650 | 2,527 | 2,412 | 1,906 | 2,587 | 2,066 | |||
| 2000's | 2,315 | 2,514 | 2,311 | 2,426 | 2,347 | 2,321 | 2,295 | 2,260 | 2,546 | 2,352 |
| 2010's | 2,380 | 2,899 | 2,530 | 1,938 | 2,769 | 2,286 | 2,005 | 2,144 | 2,301 | 2,040 |
| 2020's | 2,142 | 1,789 | 1,726 | 2,207 |
| - = No Data Reported; -- = Not Applicable; NA = Not Available; W = Withheld to avoid disclosure of individual company data. |
| Release Date: 6/28/2024 |
| Next Release Date: 8/30/2024 |