|
Download Data (XLS File) |
|
||||||||
|
||||||||
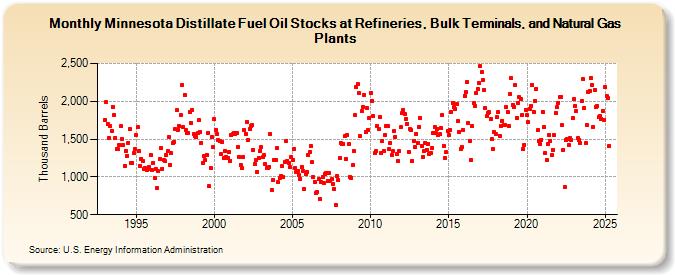
| Minnesota Distillate Fuel Oil Stocks at Refineries, Bulk Terminals, and Natural Gas Plants (Thousand Barrels) | ||||||||
| Year | Jan | Feb | Mar | Apr | May | Jun | Jul | Aug | Sep | Oct | Nov | Dec |
|---|---|---|---|---|---|---|---|---|---|---|---|---|
| 1993 | 1,756 | 1,984 | 1,706 | 1,513 | 1,672 | 1,613 | 1,931 | 1,821 | 1,516 | 1,373 | 1,365 | 1,422 |
| 1994 | 1,669 | 1,500 | 1,422 | 1,146 | 1,348 | 1,283 | 1,454 | 1,628 | 1,181 | 1,185 | 1,322 | 1,367 |
| 1995 | 1,550 | 1,654 | 1,336 | 1,148 | 1,239 | 1,215 | 1,110 | 1,116 | 1,085 | 1,110 | 1,129 | 1,292 |
| 1996 | 1,092 | 1,185 | 979 | 1,110 | 850 | 1,074 | 1,232 | 1,380 | 1,109 | 1,221 | 1,206 | 1,285 |
| 1997 | 1,345 | 1,529 | 1,162 | 1,315 | 1,444 | 1,463 | 1,632 | 1,883 | 1,626 | 1,671 | 1,821 | 2,214 |
| 1998 | 1,655 | 2,088 | 1,620 | 1,584 | 1,587 | 1,861 | 1,718 | 1,887 | 1,563 | 1,538 | 1,528 | 1,580 |
| 1999 | 1,746 | 1,591 | 1,445 | 1,189 | 1,272 | 1,227 | 1,290 | 1,585 | 875 | 1,120 | 1,534 | 1,389 |
| 2000 | 1,760 | 1,623 | 1,568 | 1,484 | 1,480 | 1,298 | 1,468 | 1,244 | 1,347 | 1,267 | 1,256 | 1,329 |
| 2001 | 1,216 | 1,548 | 1,566 | 1,586 | 1,569 | 1,586 | 1,399 | 1,267 | 1,159 | 1,113 | 1,266 | 1,615 |
| 2002 | 1,574 | 1,724 | 1,487 | 1,637 | 1,674 | 1,686 | 1,356 | 1,177 | 1,220 | 1,068 | 1,254 | 1,348 |
| 2003 | 1,390 | 1,261 | 1,284 | 1,174 | 1,123 | 1,116 | 1,136 | 1,566 | 830 | 962 | 1,220 | 1,220 |
| 2004 | 1,380 | 929 | 981 | 1,012 | 1,144 | 998 | 1,198 | 1,478 | 1,215 | 1,190 | 1,126 | 1,261 |
| 2005 | 1,225 | 1,368 | 1,118 | 1,068 | 1,083 | 1,021 | 970 | 1,132 | 1,079 | 846 | 1,038 | 1,063 |
| 2006 | 1,292 | 1,329 | 1,408 | 1,194 | 996 | 939 | 790 | 801 | 969 | 705 | 930 | 1,000 |
| 2007 | 916 | 1,044 | 1,049 | 952 | 1,054 | 940 | 968 | 908 | 839 | 629 | 1,007 | 956 |
| 2008 | 1,248 | 1,451 | 1,441 | 1,441 | 1,535 | 1,237 | 1,558 | 1,432 | 1,002 | 990 | 1,152 | 1,340 |
| 2009 | 1,814 | 2,185 | 2,227 | 2,105 | 1,535 | 1,869 | 1,926 | 2,089 | 1,598 | 1,912 | 1,615 | 1,778 |
| 2010 | 2,115 | 2,010 | 1,804 | 1,318 | 1,338 | 1,674 | 1,635 | 1,791 | 1,310 | 1,471 | 1,347 | 1,555 |
| 2011 | 1,677 | 1,669 | 1,366 | 1,449 | 1,292 | 1,338 | 1,607 | 1,534 | 1,298 | 1,210 | 1,342 | 1,656 |
| 2012 | 1,841 | 1,889 | 1,827 | 1,771 | 1,705 | 1,331 | 1,635 | 1,616 | 1,212 | 1,481 | 1,394 | 1,574 |
| 2013 | 1,455 | 1,666 | 1,777 | 1,415 | 1,268 | 1,343 | 1,453 | 1,361 | 1,439 | 1,301 | 1,317 | 1,388 |
| 2014 | 1,586 | 1,656 | 1,578 | 1,639 | 1,556 | 1,563 | 1,641 | 1,816 | 1,410 | 1,253 | 1,328 | 1,607 |
| 2015 | 1,549 | 1,625 | 1,858 | 1,976 | 1,922 | 1,903 | 1,965 | 1,736 | 1,600 | 1,371 | 1,391 | 1,623 |
| 2016 | 2,076 | 2,119 | 2,250 | 1,714 | 1,475 | 1,227 | 1,672 | 1,974 | 1,935 | 2,115 | 2,161 | 2,238 |
| 2017 | 2,462 | 2,383 | 2,283 | 2,154 | 1,909 | 1,801 | 1,842 | 1,855 | 1,765 | 1,495 | 1,366 | 1,593 |
| 2018 | 1,570 | 1,788 | 1,856 | 1,546 | 1,677 | 1,743 | 1,686 | 1,692 | 1,922 | 1,861 | 1,674 | 2,095 |
| 2019 | 2,305 | 1,955 | 1,929 | 2,215 | 1,784 | 1,981 | 2,052 | 2,026 | 1,814 | 1,370 | 1,424 | 1,889 |
| 2020 | 1,813 | 1,726 | 1,902 | 1,943 | 2,215 | 1,859 | 2,007 | 2,168 | 1,615 | 1,479 | 1,433 | 1,492 |
| 2021 | 1,864 | 1,655 | 1,311 | 1,221 | 1,434 | 1,554 | 1,473 | 1,284 | 1,357 | 1,554 | 1,847 | 1,921 |
| 2022 | 1,983 | 2,056 | 2,063 | 1,680 | 1,360 | 870 | 1,492 | 1,501 | 1,417 | 1,510 | 1,488 | 1,775 |
| 2023 | 2,024 | 1,938 | 1,873 | 1,508 | 1,492 | 1,447 | 2,003 | 2,289 | 1,911 | 1,443 | 1,688 | 2,124 |
| 2024 | 2,136 | 2,308 | 2,222 | 1,665 | 2,154 | 1,931 | 1,936 | 1,788 | 1,804 | 1,771 | 1,877 | 1,759 |
| 2025 | 2,184 | 2,070 | 2,039 | 1,408 | ||||||||
| - = No Data Reported; -- = Not Applicable; NA = Not Available; W = Withheld to avoid disclosure of individual company data. |
| Release Date: 6/30/2025 |
| Next Release Date: 7/31/2025 |