|
Download Data (XLS File) |
|
||||||||
|
||||||||
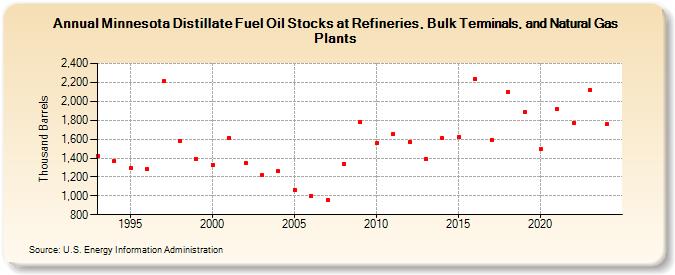
| Minnesota Distillate Fuel Oil Stocks at Refineries, Bulk Terminals, and Natural Gas Plants (Thousand Barrels) | ||||||||
| Decade | Year-0 | Year-1 | Year-2 | Year-3 | Year-4 | Year-5 | Year-6 | Year-7 | Year-8 | Year-9 |
|---|---|---|---|---|---|---|---|---|---|---|
| 1990's | 1,422 | 1,367 | 1,292 | 1,285 | 2,214 | 1,580 | 1,389 | |||
| 2000's | 1,329 | 1,615 | 1,348 | 1,220 | 1,261 | 1,063 | 1,000 | 956 | 1,340 | 1,778 |
| 2010's | 1,555 | 1,656 | 1,574 | 1,388 | 1,607 | 1,623 | 2,238 | 1,593 | 2,095 | 1,889 |
| 2020's | 1,492 | 1,921 | 1,775 | 2,124 |
| - = No Data Reported; -- = Not Applicable; NA = Not Available; W = Withheld to avoid disclosure of individual company data. |
| Release Date: 3/29/2024 |
| Next Release Date: 8/30/2024 |