|
Download Data (XLS File) |
|
||||||||
|
||||||||
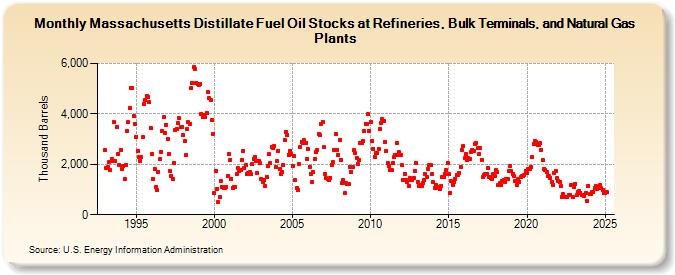
| Massachusetts Distillate Fuel Oil Stocks at Refineries, Bulk Terminals, and Natural Gas Plants (Thousand Barrels) | ||||||||
| Year | Jan | Feb | Mar | Apr | May | Jun | Jul | Aug | Sep | Oct | Nov | Dec |
|---|---|---|---|---|---|---|---|---|---|---|---|---|
| 1993 | 2,557 | 1,855 | 1,882 | 2,082 | 1,755 | 2,191 | 2,128 | 3,683 | 2,112 | 3,496 | 2,421 | 1,964 |
| 1994 | 2,580 | 1,833 | 1,916 | 1,417 | 1,975 | 3,312 | 3,660 | 4,229 | 5,025 | 5,032 | 3,906 | 3,612 |
| 1995 | 3,100 | 2,531 | 2,272 | 2,138 | 2,273 | 3,076 | 4,392 | 4,570 | 4,700 | 4,688 | 4,471 | 3,448 |
| 1996 | 2,423 | 1,399 | 1,830 | 1,113 | 979 | 1,714 | 2,201 | 2,505 | 3,330 | 3,874 | 3,255 | 3,566 |
| 1997 | 3,002 | 2,417 | 1,719 | 1,540 | 1,410 | 2,059 | 3,377 | 3,418 | 3,634 | 3,818 | 3,485 | 3,494 |
| 1998 | 3,157 | 2,907 | 2,378 | 3,415 | 3,665 | 3,613 | 5,020 | 5,229 | 5,843 | 5,799 | 5,235 | 5,195 |
| 1999 | 5,133 | 5,202 | 3,987 | 3,892 | 3,952 | 3,858 | 4,029 | 4,853 | 4,630 | 4,547 | 3,741 | 3,221 |
| 2000 | 881 | 1,733 | 1,040 | 503 | 699 | 1,318 | 1,104 | 1,059 | 1,076 | 1,107 | 1,552 | 2,401 |
| 2001 | 2,187 | 1,420 | 1,071 | 1,105 | 1,100 | 1,609 | 1,839 | 1,726 | 1,758 | 2,172 | 2,543 | 1,838 |
| 2002 | 1,965 | 1,597 | 1,660 | 1,677 | 1,603 | 2,001 | 2,202 | 2,276 | 2,135 | 1,636 | 2,112 | 2,038 |
| 2003 | 1,430 | 1,281 | 1,395 | 1,147 | 1,489 | 1,915 | 2,391 | 2,049 | 2,687 | 2,648 | 2,746 | 1,897 |
| 2004 | 2,116 | 2,546 | 1,798 | 1,635 | 1,712 | 1,988 | 2,951 | 3,286 | 3,162 | 2,381 | 2,534 | 2,398 |
| 2005 | 1,945 | 2,343 | 1,366 | 1,043 | 976 | 1,999 | 2,672 | 2,891 | 2,844 | 2,958 | 2,865 | 2,229 |
| 2006 | 2,596 | 1,905 | 1,628 | 1,280 | 1,676 | 2,222 | 2,482 | 2,581 | 3,210 | 3,145 | 3,591 | 3,696 |
| 2007 | 2,668 | 1,606 | 1,443 | 1,430 | 1,387 | 1,474 | 1,985 | 2,084 | 2,569 | 3,191 | 2,584 | 2,386 |
| 2008 | 2,954 | 2,186 | 1,257 | 1,365 | 849 | 1,271 | 1,200 | 1,229 | 1,908 | 1,705 | 1,879 | 2,550 |
| 2009 | 2,443 | 2,251 | 2,014 | 2,171 | 2,865 | 2,846 | 2,932 | 3,308 | 3,600 | 3,605 | 3,976 | 3,330 |
| 2010 | 3,670 | 2,920 | 2,621 | 2,301 | 2,430 | 2,435 | 2,618 | 3,393 | 3,636 | 3,785 | 3,737 | 2,901 |
| 2011 | 2,537 | 2,066 | 1,949 | 1,755 | 1,762 | 2,071 | 2,272 | 2,376 | 2,838 | 2,367 | 2,469 | 2,371 |
| 2012 | 1,956 | 1,383 | 1,619 | 1,360 | 1,297 | 1,141 | 1,460 | 1,368 | 1,394 | 1,474 | 1,735 | 2,055 |
| 2013 | 1,299 | 1,136 | 1,182 | 1,132 | 1,258 | 1,358 | 1,615 | 1,490 | 1,827 | 1,956 | 1,972 | 1,602 |
| 2014 | 1,279 | 1,067 | 1,172 | 1,099 | 1,073 | 1,005 | 1,157 | 1,489 | 1,486 | 1,627 | 1,778 | 2,070 |
| 2015 | 1,611 | 881 | 1,325 | 1,196 | 1,290 | 1,431 | 1,590 | 1,590 | 1,642 | 1,897 | 2,561 | 2,716 |
| 2016 | 2,238 | 2,420 | 2,172 | 2,245 | 2,230 | 2,498 | 2,581 | 2,519 | 2,821 | 2,853 | 2,633 | 2,421 |
| 2017 | 2,652 | 2,173 | 1,484 | 1,557 | 1,614 | 1,632 | 1,853 | 1,507 | 1,456 | 1,433 | 1,607 | 1,536 |
| 2018 | 1,755 | 1,710 | 1,195 | 1,251 | 1,174 | 1,350 | 1,378 | 1,310 | 1,410 | 1,429 | 1,724 | 1,929 |
| 2019 | 1,734 | 1,618 | 1,522 | 1,318 | 1,181 | 1,412 | 1,309 | 1,479 | 1,525 | 1,550 | 1,574 | 1,745 |
| 2020 | 1,655 | 1,817 | 1,819 | 1,907 | 2,288 | 2,821 | 2,941 | 2,868 | 2,771 | 2,769 | 2,833 | 2,579 |
| 2021 | 2,160 | 1,818 | 1,790 | 1,713 | 1,521 | 1,530 | 1,450 | 1,316 | 1,179 | 1,670 | 1,725 | 1,444 |
| 2022 | 1,345 | 1,312 | 1,147 | 702 | 809 | 705 | 714 | 698 | 786 | 797 | 1,196 | 692 |
| 2023 | 1,100 | 1,231 | 788 | 905 | 934 | 880 | 796 | 798 | 760 | 880 | 539 | 1,157 |
| 2024 | 819 | |||||||||||
| - = No Data Reported; -- = Not Applicable; NA = Not Available; W = Withheld to avoid disclosure of individual company data. |
| Release Date: 3/29/2024 |
| Next Release Date: 4/30/2024 |