|
Download Data (XLS File) |
|
||||||||
|
||||||||
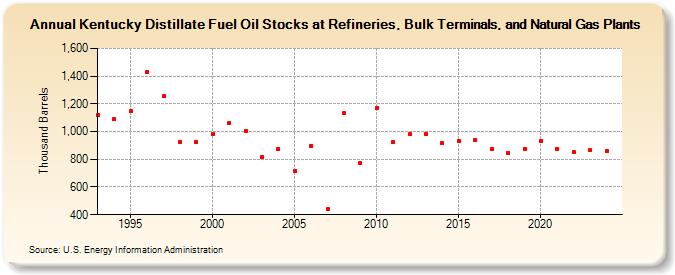
| Kentucky Distillate Fuel Oil Stocks at Refineries, Bulk Terminals, and Natural Gas Plants (Thousand Barrels) | ||||||||
| Decade | Year-0 | Year-1 | Year-2 | Year-3 | Year-4 | Year-5 | Year-6 | Year-7 | Year-8 | Year-9 |
|---|---|---|---|---|---|---|---|---|---|---|
| 1990's | 1,116 | 1,090 | 1,146 | 1,433 | 1,254 | 925 | 927 | |||
| 2000's | 981 | 1,059 | 1,004 | 816 | 873 | 717 | 897 | 439 | 1,131 | 772 |
| 2010's | 1,168 | 923 | 981 | 983 | 914 | 935 | 936 | 874 | 846 | 873 |
| 2020's | 934 | 872 | 854 | 864 |
| - = No Data Reported; -- = Not Applicable; NA = Not Available; W = Withheld to avoid disclosure of individual company data. |
| Release Date: 3/29/2024 |
| Next Release Date: 8/30/2024 |