|
Download Data (XLS File) |
|
||||||||
|
||||||||
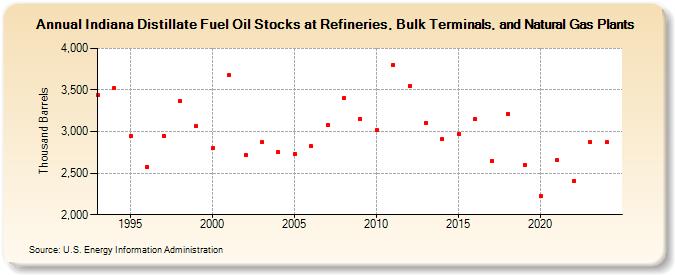
| Indiana Distillate Fuel Oil Stocks at Refineries, Bulk Terminals, and Natural Gas Plants (Thousand Barrels) | ||||||||
| Decade | Year-0 | Year-1 | Year-2 | Year-3 | Year-4 | Year-5 | Year-6 | Year-7 | Year-8 | Year-9 |
|---|---|---|---|---|---|---|---|---|---|---|
| 1990's | 3,435 | 3,518 | 2,941 | 2,576 | 2,951 | 3,363 | 3,061 | |||
| 2000's | 2,798 | 3,675 | 2,717 | 2,869 | 2,752 | 2,731 | 2,821 | 3,078 | 3,405 | 3,149 |
| 2010's | 3,014 | 3,801 | 3,549 | 3,107 | 2,909 | 2,968 | 3,147 | 2,650 | 3,216 | 2,598 |
| 2020's | 2,223 | 2,657 | 2,403 | 2,899 |
| - = No Data Reported; -- = Not Applicable; NA = Not Available; W = Withheld to avoid disclosure of individual company data. |
| Release Date: 3/29/2024 |
| Next Release Date: 8/30/2024 |