|
Download Data (XLS File) |
|
||||||||
|
||||||||
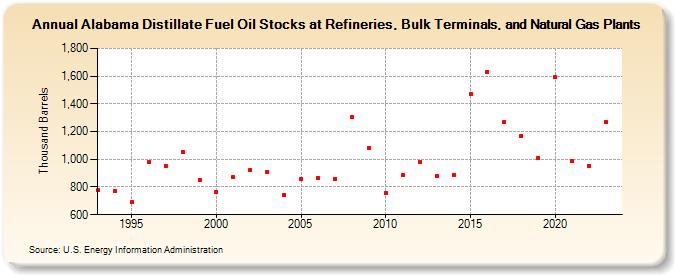
| Alabama Distillate Fuel Oil Stocks at Refineries, Bulk Terminals, and Natural Gas Plants (Thousand Barrels) | ||||||||
| Decade | Year-0 | Year-1 | Year-2 | Year-3 | Year-4 | Year-5 | Year-6 | Year-7 | Year-8 | Year-9 |
|---|---|---|---|---|---|---|---|---|---|---|
| 1990's | 775 | 768 | 690 | 979 | 955 | 1,055 | 851 | |||
| 2000's | 761 | 874 | 925 | 909 | 743 | 859 | 867 | 858 | 1,307 | 1,084 |
| 2010's | 759 | 883 | 979 | 879 | 889 | 1,471 | 1,632 | 1,269 | 1,171 | 1,009 |
| 2020's | 1,594 | 987 | 950 | 1,272 |
| - = No Data Reported; -- = Not Applicable; NA = Not Available; W = Withheld to avoid disclosure of individual company data. |
| Release Date: 3/29/2024 |
| Next Release Date: 8/30/2024 |