|
Download Data (XLS File) |
|
||||||||
|
||||||||
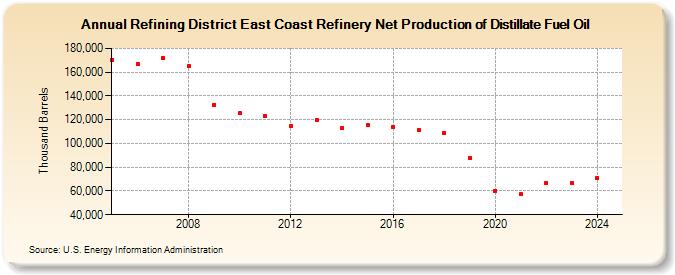
| Refining District East Coast Refinery Net Production of Distillate Fuel Oil (Thousand Barrels) | ||||||||
| Decade | Year-0 | Year-1 | Year-2 | Year-3 | Year-4 | Year-5 | Year-6 | Year-7 | Year-8 | Year-9 |
|---|---|---|---|---|---|---|---|---|---|---|
| 2000's | 170,605 | 166,980 | 172,140 | 165,180 | 132,751 | |||||
| 2010's | 125,230 | 123,299 | 114,460 | 119,319 | 113,311 | 115,488 | 114,240 | 111,400 | 108,982 | 87,863 |
| 2020's | 60,293 | 57,029 | 66,887 | 66,806 |
| - = No Data Reported; -- = Not Applicable; NA = Not Available; W = Withheld to avoid disclosure of individual company data. |
| Release Date: 6/28/2024 |
| Next Release Date: 8/30/2024 |