|
Download Data (XLS File) |
|
||||||||
|
||||||||
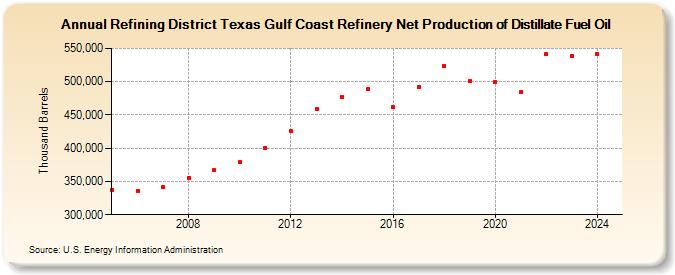
| Refining District Texas Gulf Coast Refinery Net Production of Distillate Fuel Oil (Thousand Barrels) | ||||||||
| Decade | Year-0 | Year-1 | Year-2 | Year-3 | Year-4 | Year-5 | Year-6 | Year-7 | Year-8 | Year-9 |
|---|---|---|---|---|---|---|---|---|---|---|
| 2000's | 337,171 | 335,664 | 341,282 | 355,917 | 366,564 | |||||
| 2010's | 379,008 | 400,692 | 425,318 | 458,235 | 476,986 | 488,347 | 461,173 | 492,622 | 523,466 | 501,059 |
| 2020's | 499,119 | 483,744 | 541,331 | 542,158 |
| - = No Data Reported; -- = Not Applicable; NA = Not Available; W = Withheld to avoid disclosure of individual company data. |
| Release Date: 6/28/2024 |
| Next Release Date: 8/30/2024 |