|
Download Data (XLS File) |
|
||||||||
|
||||||||
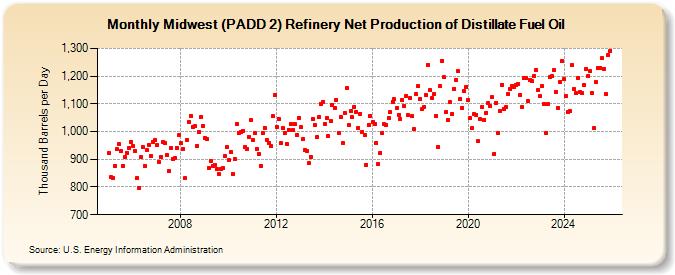
| Midwest (PADD 2) Refinery Net Production of Distillate Fuel Oil (Thousand Barrels per Day) | ||||||||
| Year | Jan | Feb | Mar | Apr | May | Jun | Jul | Aug | Sep | Oct | Nov | Dec |
|---|---|---|---|---|---|---|---|---|---|---|---|---|
| 2005 | 923 | 835 | 832 | 875 | 937 | 955 | 929 | 877 | 908 | 924 | 939 | 962 |
| 2006 | 949 | 931 | 832 | 797 | 909 | 943 | 876 | 933 | 951 | 913 | 963 | 968 |
| 2007 | 951 | 891 | 910 | 963 | 959 | 915 | 856 | 940 | 902 | 905 | 942 | 988 |
| 2008 | 957 | 938 | 831 | 970 | 1,035 | 1,057 | 1,018 | 1,020 | 949 | 1,000 | 1,053 | 1,021 |
| 2009 | 977 | 972 | 870 | 893 | 877 | 881 | 866 | 848 | 865 | 869 | 912 | 944 |
| 2010 | 896 | 928 | 848 | 901 | 1,027 | 994 | 998 | 1,003 | 945 | 936 | 981 | 1,041 |
| 2011 | 969 | 993 | 938 | 920 | 877 | 996 | 1,014 | 971 | 960 | 949 | 1,055 | 1,131 |
| 2012 | 1,018 | 1,047 | 957 | 1,013 | 993 | 956 | 1,007 | 1,027 | 1,005 | 1,028 | 989 | 1,050 |
| 2013 | 1,015 | 973 | 933 | 930 | 886 | 910 | 1,047 | 1,024 | 979 | 1,051 | 1,101 | 1,107 |
| 2014 | 1,028 | 1,049 | 983 | 1,037 | 1,096 | 1,085 | 1,115 | 996 | 1,053 | 958 | 1,067 | 1,158 |
| 2015 | 1,023 | 1,074 | 1,051 | 1,090 | 1,072 | 1,013 | 1,064 | 999 | 986 | 880 | 1,025 | 1,057 |
| 2016 | 1,034 | 1,027 | 958 | 883 | 923 | 993 | 1,026 | 1,024 | 1,048 | 1,070 | 1,108 | 1,116 |
| 2017 | 1,085 | 1,061 | 1,046 | 1,115 | 1,092 | 1,129 | 1,058 | 1,121 | 1,056 | 1,008 | 1,135 | 1,164 |
| 2018 | 1,117 | 1,082 | 1,089 | 1,131 | 1,241 | 1,149 | 1,120 | 1,135 | 1,057 | 946 | 1,163 | 1,256 |
| 2019 | 1,195 | 1,071 | 1,042 | 1,105 | 1,064 | 1,155 | 1,187 | 1,217 | 1,117 | 1,086 | 1,147 | 1,162 |
| 2020 | 1,114 | 1,048 | 1,013 | 1,064 | 1,061 | 965 | 1,046 | 1,090 | 1,043 | 1,068 | 1,103 | 1,092 |
| 2021 | 1,123 | 920 | 1,104 | 996 | 1,074 | 1,169 | 1,083 | 1,089 | 1,136 | 1,152 | 1,166 | 1,162 |
| 2022 | 1,168 | 1,172 | 1,133 | 1,089 | 1,192 | 1,192 | 1,111 | 1,187 | 1,181 | 1,202 | 1,222 | 1,151 |
| 2023 | 1,128 | 1,164 | 1,098 | 996 | 1,100 | 1,195 | 1,199 | 1,222 | 1,143 | 1,085 | 1,180 | 1,254 |
| 2024 | 1,188 | 1,127 | ||||||||||
| - = No Data Reported; -- = Not Applicable; NA = Not Available; W = Withheld to avoid disclosure of individual company data. |
| Release Date: 4/30/2024 |
| Next Release Date: 5/31/2024 |