|
Download Data (XLS File) |
|
||||||||
|
||||||||
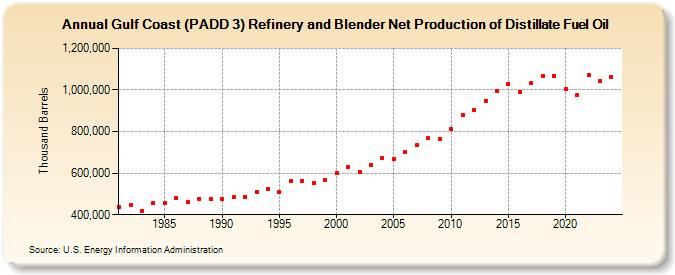
| Gulf Coast (PADD 3) Refinery and Blender Net Production of Distillate Fuel Oil (Thousand Barrels) | ||||||||
| Decade | Year-0 | Year-1 | Year-2 | Year-3 | Year-4 | Year-5 | Year-6 | Year-7 | Year-8 | Year-9 |
|---|---|---|---|---|---|---|---|---|---|---|
| 1980's | 439,472 | 447,185 | 419,694 | 455,468 | 454,399 | 481,490 | 462,345 | 477,043 | 473,664 | |
| 1990's | 475,890 | 483,479 | 484,546 | 510,539 | 524,348 | 510,061 | 559,843 | 561,685 | 553,707 | 564,727 |
| 2000's | 600,059 | 629,328 | 606,843 | 638,606 | 671,808 | 669,470 | 703,716 | 734,607 | 767,038 | 766,273 |
| 2010's | 810,321 | 881,791 | 904,623 | 947,457 | 993,606 | 1,027,526 | 992,142 | 1,032,338 | 1,068,679 | 1,069,355 |
| 2020's | 1,004,562 | 974,531 | 1,071,783 | 1,049,381 |
| - = No Data Reported; -- = Not Applicable; NA = Not Available; W = Withheld to avoid disclosure of individual company data. |
| Release Date: 3/29/2024 |
| Next Release Date: 8/30/2024 |