|
Download Data (XLS File) |
|
||||||||
|
||||||||
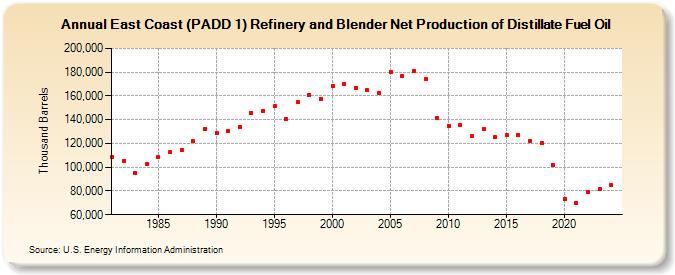
| East Coast (PADD 1) Refinery and Blender Net Production of Distillate Fuel Oil (Thousand Barrels) | ||||||||
| Decade | Year-0 | Year-1 | Year-2 | Year-3 | Year-4 | Year-5 | Year-6 | Year-7 | Year-8 | Year-9 |
|---|---|---|---|---|---|---|---|---|---|---|
| 1980's | 108,597 | 105,473 | 94,985 | 102,883 | 108,207 | 112,502 | 114,402 | 121,951 | 132,233 | |
| 1990's | 128,387 | 130,637 | 133,697 | 145,951 | 147,309 | 151,155 | 140,425 | 154,771 | 161,089 | 157,418 |
| 2000's | 168,168 | 170,109 | 166,959 | 164,573 | 162,836 | 180,348 | 176,753 | 180,583 | 174,230 | 141,320 |
| 2010's | 134,679 | 135,152 | 125,917 | 131,941 | 125,268 | 127,016 | 127,225 | 122,249 | 120,496 | 101,637 |
| 2020's | 73,050 | 69,581 | 79,472 | 81,544 |
| - = No Data Reported; -- = Not Applicable; NA = Not Available; W = Withheld to avoid disclosure of individual company data. |
| Release Date: 6/28/2024 |
| Next Release Date: 8/30/2024 |