|
Download Data (XLS File) |
|
||||||||
|
||||||||
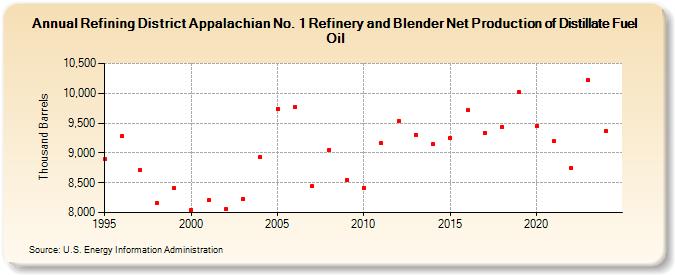
| Refining District Appalachian No. 1 Refinery and Blender Net Production of Distillate Fuel Oil (Thousand Barrels) | ||||||||
| Decade | Year-0 | Year-1 | Year-2 | Year-3 | Year-4 | Year-5 | Year-6 | Year-7 | Year-8 | Year-9 |
|---|---|---|---|---|---|---|---|---|---|---|
| 1990's | 8,897 | 9,283 | 8,713 | 8,166 | 8,406 | |||||
| 2000's | 8,043 | 8,205 | 8,054 | 8,224 | 8,929 | 9,743 | 9,773 | 8,443 | 9,050 | 8,542 |
| 2010's | 8,412 | 9,159 | 9,535 | 9,309 | 9,143 | 9,255 | 9,713 | 9,341 | 9,436 | 10,015 |
| 2020's | 9,448 | 9,194 | 8,750 | 10,221 |
| - = No Data Reported; -- = Not Applicable; NA = Not Available; W = Withheld to avoid disclosure of individual company data. |
| Release Date: 3/29/2024 |
| Next Release Date: 8/30/2024 |