|
Download Data (XLS File) |
|
||||||||
|
||||||||
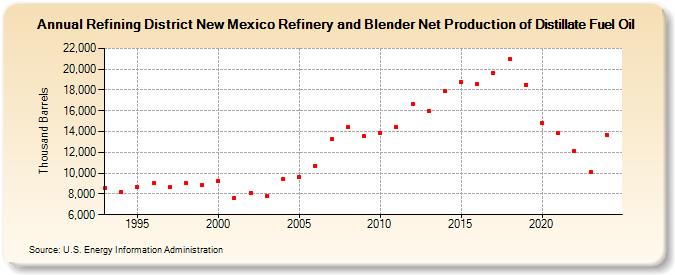
| Refining District New Mexico Refinery and Blender Net Production of Distillate Fuel Oil (Thousand Barrels) | ||||||||
| Decade | Year-0 | Year-1 | Year-2 | Year-3 | Year-4 | Year-5 | Year-6 | Year-7 | Year-8 | Year-9 |
|---|---|---|---|---|---|---|---|---|---|---|
| 1990's | 8,539 | 8,150 | 8,691 | 9,040 | 8,651 | 9,058 | 8,846 | |||
| 2000's | 9,285 | 7,598 | 8,119 | 7,786 | 9,471 | 9,632 | 10,691 | 13,296 | 14,401 | 13,528 |
| 2010's | 13,887 | 14,432 | 16,641 | 16,023 | 17,923 | 18,808 | 18,570 | 19,600 | 20,983 | 18,505 |
| 2020's | 14,805 | 13,822 | 12,107 | 10,104 | 13,681 |
| - = No Data Reported; -- = Not Applicable; NA = Not Available; W = Withheld to avoid disclosure of individual company data. |
| Release Date: 6/30/2025 |
| Next Release Date: 8/29/2025 |