|
Download Data (XLS File) |
|
||||||||
|
||||||||
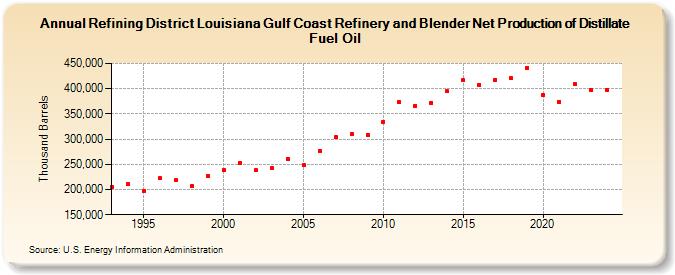
| Refining District Louisiana Gulf Coast Refinery and Blender Net Production of Distillate Fuel Oil (Thousand Barrels) | ||||||||
| Decade | Year-0 | Year-1 | Year-2 | Year-3 | Year-4 | Year-5 | Year-6 | Year-7 | Year-8 | Year-9 |
|---|---|---|---|---|---|---|---|---|---|---|
| 1990's | 205,645 | 210,399 | 197,920 | 222,535 | 218,206 | 206,847 | 226,452 | |||
| 2000's | 239,075 | 252,423 | 238,332 | 243,004 | 261,488 | 247,789 | 275,922 | 303,183 | 309,987 | 308,181 |
| 2010's | 334,765 | 373,526 | 366,306 | 372,398 | 394,699 | 416,314 | 407,665 | 418,121 | 420,956 | 441,391 |
| 2020's | 387,658 | 374,220 | 408,759 | 397,326 |
| - = No Data Reported; -- = Not Applicable; NA = Not Available; W = Withheld to avoid disclosure of individual company data. |
| Release Date: 8/30/2024 |
| Next Release Date: 8/29/2025 |