|
Download Data (XLS File) |
|
||||||||
|
||||||||
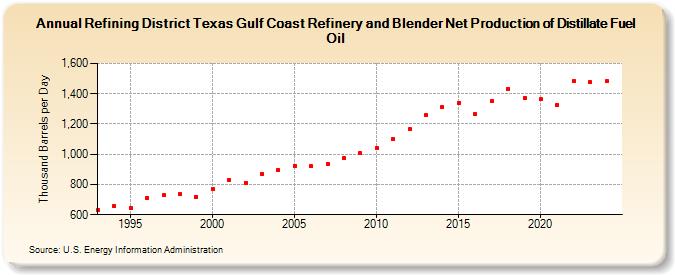
| Refining District Texas Gulf Coast Refinery and Blender Net Production of Distillate Fuel Oil (Thousand Barrels per Day) | ||||||||
| Decade | Year-0 | Year-1 | Year-2 | Year-3 | Year-4 | Year-5 | Year-6 | Year-7 | Year-8 | Year-9 |
|---|---|---|---|---|---|---|---|---|---|---|
| 1990's | 631 | 656 | 646 | 711 | 728 | 735 | 719 | |||
| 2000's | 767 | 831 | 813 | 872 | 895 | 924 | 920 | 935 | 972 | 1,006 |
| 2010's | 1,041 | 1,100 | 1,165 | 1,259 | 1,309 | 1,341 | 1,263 | 1,349 | 1,434 | 1,374 |
| 2020's | 1,363 | 1,327 | 1,485 | 1,487 |
| - = No Data Reported; -- = Not Applicable; NA = Not Available; W = Withheld to avoid disclosure of individual company data. |
| Release Date: 6/28/2024 |
| Next Release Date: 8/30/2024 |