|
Download Data (XLS File) |
|
||||||||
|
||||||||
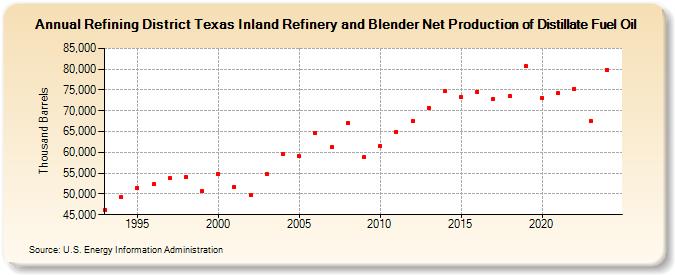
| Refining District Texas Inland Refinery and Blender Net Production of Distillate Fuel Oil (Thousand Barrels) | ||||||||
| Decade | Year-0 | Year-1 | Year-2 | Year-3 | Year-4 | Year-5 | Year-6 | Year-7 | Year-8 | Year-9 |
|---|---|---|---|---|---|---|---|---|---|---|
| 1990's | 46,145 | 49,150 | 51,457 | 52,280 | 53,732 | 54,023 | 50,686 | |||
| 2000's | 54,893 | 51,672 | 49,719 | 54,818 | 59,510 | 59,053 | 64,752 | 61,280 | 67,071 | 58,797 |
| 2010's | 61,610 | 64,921 | 67,593 | 70,747 | 74,669 | 73,193 | 74,604 | 72,852 | 73,434 | 80,684 |
| 2020's | 73,157 | 74,218 | 75,335 | 67,501 |
| - = No Data Reported; -- = Not Applicable; NA = Not Available; W = Withheld to avoid disclosure of individual company data. |
| Release Date: 3/29/2024 |
| Next Release Date: 8/30/2024 |