|
Download Data (XLS File) |
|
||||||||
|
||||||||
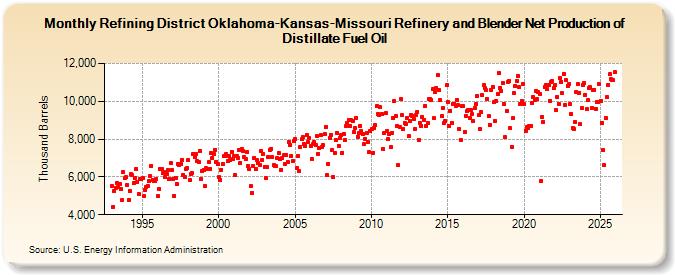
| Refining District Oklahoma-Kansas-Missouri Refinery and Blender Net Production of Distillate Fuel Oil (Thousand Barrels) | ||||||||
| Year | Jan | Feb | Mar | Apr | May | Jun | Jul | Aug | Sep | Oct | Nov | Dec |
|---|---|---|---|---|---|---|---|---|---|---|---|---|
| 1993 | 5,521 | 4,427 | 5,278 | 5,414 | 5,678 | 5,474 | 5,610 | 5,347 | 4,752 | 6,259 | 5,917 | 5,972 |
| 1994 | 5,584 | 4,769 | 5,276 | 6,131 | 6,080 | 5,659 | 5,929 | 6,414 | 5,715 | 5,106 | 5,913 | 5,902 |
| 1995 | 5,916 | 4,965 | 5,319 | 5,489 | 5,511 | 5,764 | 6,045 | 6,597 | 5,845 | 5,773 | 5,783 | 5,883 |
| 1996 | 4,975 | 5,355 | 6,406 | 6,431 | 6,182 | 6,252 | 5,992 | 6,143 | 6,368 | 5,913 | 6,723 | 6,362 |
| 1997 | 5,878 | 5,004 | 5,959 | 5,619 | 6,669 | 6,649 | 6,666 | 6,908 | 6,113 | 5,995 | 6,427 | 6,460 |
| 1998 | 6,907 | 5,814 | 6,152 | 6,182 | 7,197 | 7,029 | 7,213 | 6,819 | 6,800 | 7,362 | 5,899 | 6,310 |
| 1999 | 6,381 | 5,498 | 6,453 | 6,398 | 6,772 | 6,444 | 7,261 | 7,015 | 7,213 | 7,416 | 6,809 | 6,670 |
| 2000 | 5,993 | 5,821 | 6,388 | 6,708 | 7,081 | 7,093 | 7,224 | 6,853 | 7,121 | 6,875 | 7,338 | 6,956 |
| 2001 | 7,126 | 6,092 | 7,100 | 7,002 | 7,439 | 6,742 | 7,480 | 7,347 | 7,037 | 6,946 | 7,320 | 6,575 |
| 2002 | 6,416 | 5,494 | 5,159 | 6,552 | 7,011 | 6,429 | 6,869 | 6,712 | 6,635 | 7,358 | 6,906 | 7,212 |
| 2003 | 6,550 | 5,917 | 6,504 | 7,074 | 7,414 | 7,494 | 7,034 | 6,616 | 6,571 | 6,554 | 7,008 | 7,278 |
| 2004 | 6,942 | 6,390 | 6,991 | 7,155 | 6,695 | 7,183 | 6,794 | 7,869 | 7,691 | 7,098 | 6,832 | 7,894 |
| 2005 | 8,001 | 6,458 | 7,080 | 6,286 | 7,581 | 7,988 | 8,115 | 7,729 | 7,639 | 8,232 | 7,825 | 8,061 |
| 2006 | 7,660 | 6,961 | 7,718 | 7,830 | 7,698 | 8,155 | 7,228 | 7,535 | 8,215 | 7,570 | 7,679 | 8,282 |
| 2007 | 8,664 | 6,096 | 6,691 | 8,071 | 8,241 | 7,411 | 6,008 | 7,287 | 7,970 | 8,333 | 7,660 | 8,045 |
| 2008 | 8,191 | 7,291 | 8,292 | 7,941 | 8,708 | 8,876 | 9,014 | 8,691 | 8,984 | 8,970 | 8,367 | 8,596 |
| 2009 | 9,119 | 8,130 | 8,323 | 8,717 | 8,425 | 8,268 | 7,734 | 8,017 | 8,344 | 7,839 | 7,309 | 8,442 |
| 2010 | 8,523 | 7,289 | 8,561 | 8,732 | 9,744 | 9,316 | 9,288 | 9,675 | 9,326 | 7,467 | 8,346 | 9,362 |
| 2011 | 8,428 | 8,002 | 8,251 | 7,568 | 8,348 | 9,135 | 10,025 | 9,233 | 8,714 | 6,616 | 8,644 | 10,098 |
| 2012 | 9,271 | 8,528 | 8,849 | 8,787 | 9,138 | 8,146 | 8,982 | 9,282 | 9,233 | 9,078 | 8,545 | 9,265 |
| 2013 | 9,450 | 7,968 | 8,833 | 8,695 | 9,166 | 9,000 | 9,738 | 8,709 | 8,833 | 10,117 | 10,125 | 10,059 |
| 2014 | 10,634 | 9,096 | 10,482 | 10,698 | 11,368 | 10,596 | 10,064 | 9,206 | 9,656 | 8,873 | 8,957 | 10,840 |
| 2015 | 9,963 | 8,681 | 9,502 | 8,861 | 9,847 | 9,872 | 9,755 | 10,062 | 9,790 | 8,534 | 7,963 | 9,767 |
| 2016 | 9,747 | 8,378 | 9,246 | 9,467 | 9,526 | 9,113 | 9,545 | 9,312 | 8,936 | 9,635 | 9,857 | 10,268 |
| 2017 | 9,267 | 8,528 | 9,407 | 10,329 | 10,839 | 10,677 | 10,573 | 10,117 | 9,216 | 8,763 | 10,594 | 10,776 |
| 2018 | 9,955 | 8,971 | 10,003 | 10,385 | 11,501 | 10,721 | 10,564 | 10,974 | 9,835 | 8,086 | 9,510 | 11,022 |
| 2019 | 11,076 | 8,569 | 7,607 | 9,107 | 10,430 | 10,835 | 11,090 | 11,363 | 10,747 | 9,873 | 9,991 | 10,926 |
| 2020 | 9,832 | 8,452 | 8,629 | 8,574 | 8,703 | 8,706 | 9,887 | 10,249 | 10,075 | 10,540 | 10,125 | 10,501 |
| 2021 | 10,389 | 5,757 | 9,170 | 8,917 | 10,759 | 10,868 | 10,637 | 10,847 | 10,033 | 11,026 | 11,070 | 10,690 |
| 2022 | 10,841 | 9,545 | 10,223 | 9,858 | 11,209 | 11,046 | 10,418 | 11,459 | 9,820 | 11,106 | 10,814 | 10,912 |
| 2023 | 9,878 | 9,338 | 8,600 | 8,556 | 8,895 | 10,516 | 10,896 | 10,464 | 8,774 | 9,639 | 10,887 | 10,989 |
| 2024 | 10,336 | 9,576 | 10,089 | 10,702 | ||||||||
| - = No Data Reported; -- = Not Applicable; NA = Not Available; W = Withheld to avoid disclosure of individual company data. |
| Release Date: 6/28/2024 |
| Next Release Date: 7/31/2024 |