|
Download Data (XLS File) |
|
||||||||
|
||||||||
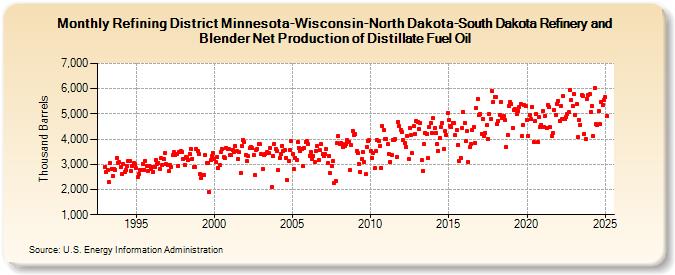
| Refining District Minnesota-Wisconsin-North Dakota-South Dakota Refinery and Blender Net Production of Distillate Fuel Oil (Thousand Barrels) | ||||||||
| Year | Jan | Feb | Mar | Apr | May | Jun | Jul | Aug | Sep | Oct | Nov | Dec |
|---|---|---|---|---|---|---|---|---|---|---|---|---|
| 1993 | 2,900 | 2,696 | 2,772 | 2,288 | 3,046 | 2,830 | 2,525 | 2,819 | 2,783 | 3,262 | 3,064 | 3,077 |
| 1994 | 2,901 | 2,633 | 3,018 | 2,687 | 2,764 | 2,914 | 3,126 | 3,129 | 2,727 | 2,941 | 3,039 | 3,003 |
| 1995 | 2,834 | 2,512 | 2,609 | 2,774 | 2,763 | 3,030 | 2,789 | 3,138 | 2,934 | 2,732 | 2,946 | 2,800 |
| 1996 | 2,876 | 2,706 | 2,905 | 3,163 | 3,026 | 3,060 | 2,817 | 3,236 | 2,989 | 3,191 | 3,458 | 2,995 |
| 1997 | 2,976 | 2,743 | 2,974 | 2,897 | 3,361 | 3,478 | 3,350 | 3,405 | 2,950 | 3,501 | 3,521 | 3,486 |
| 1998 | 3,217 | 2,989 | 3,281 | 3,255 | 3,184 | 3,411 | 3,609 | 3,229 | 2,892 | 2,909 | 3,620 | 3,544 |
| 1999 | 3,392 | 2,625 | 2,444 | 2,562 | 2,572 | 3,350 | 3,036 | 3,038 | 1,894 | 3,159 | 3,313 | 3,451 |
| 2000 | 3,220 | 3,073 | 3,282 | 2,866 | 2,953 | 3,474 | 3,606 | 3,288 | 3,253 | 3,659 | 3,603 | 3,590 |
| 2001 | 3,365 | 3,356 | 3,581 | 3,504 | 3,719 | 3,514 | 3,202 | 3,484 | 2,651 | 3,725 | 3,973 | 3,875 |
| 2002 | 3,381 | 3,113 | 3,313 | 3,627 | 3,668 | 3,638 | 3,360 | 2,566 | 3,579 | 3,619 | 3,802 | 3,790 |
| 2003 | 3,391 | 2,823 | 3,369 | 3,413 | 3,475 | 3,462 | 3,455 | 3,649 | 2,109 | 3,330 | 3,823 | 3,618 |
| 2004 | 3,514 | 2,783 | 3,245 | 3,405 | 3,739 | 3,529 | 3,565 | 3,266 | 2,374 | 3,138 | 3,568 | 3,918 |
| 2005 | 3,399 | 2,800 | 3,260 | 3,171 | 3,876 | 3,648 | 3,536 | 3,610 | 2,921 | 3,661 | 3,887 | 3,909 |
| 2006 | 3,787 | 3,348 | 3,489 | 3,219 | 3,326 | 3,110 | 3,547 | 3,736 | 3,174 | 3,555 | 3,802 | 3,406 |
| 2007 | 3,317 | 3,394 | 3,605 | 3,032 | 3,322 | 2,646 | 2,950 | 3,128 | 2,271 | 2,323 | 3,833 | 4,112 |
| 2008 | 3,824 | 3,835 | 3,814 | 3,676 | 3,729 | 3,794 | 3,973 | 3,871 | 2,774 | 3,748 | 4,340 | 4,156 |
| 2009 | 4,207 | 3,543 | 3,438 | 3,013 | 2,714 | 3,204 | 3,493 | 3,100 | 2,602 | 3,698 | 3,942 | 3,958 |
| 2010 | 3,520 | 3,247 | 3,465 | 2,834 | 3,516 | 3,945 | 3,934 | 3,739 | 2,860 | 4,520 | 4,361 | 4,003 |
| 2011 | 4,002 | 3,795 | 3,415 | 3,107 | 3,359 | 3,960 | 3,954 | 3,995 | 3,306 | 4,689 | 4,501 | 4,361 |
| 2012 | 4,270 | 3,960 | 3,835 | 3,693 | 4,109 | 3,220 | 4,441 | 4,165 | 3,429 | 4,506 | 4,218 | 4,729 |
| 2013 | 4,683 | 4,382 | 4,621 | 3,154 | 2,729 | 3,789 | 4,248 | 4,210 | 3,232 | 4,491 | 4,644 | 4,245 |
| 2014 | 4,824 | 4,432 | 4,244 | 3,810 | 3,528 | 4,036 | 4,468 | 4,653 | 3,611 | 4,308 | 4,162 | 5,042 |
| 2015 | 4,752 | 4,506 | 4,472 | 4,634 | 4,645 | 4,147 | 4,367 | 3,761 | 3,131 | 3,267 | 4,448 | 5,082 |
| 2016 | 4,655 | 3,911 | 4,303 | 3,080 | 3,684 | 3,791 | 4,349 | 4,479 | 3,857 | 5,239 | 5,602 | 4,964 |
| 2017 | 4,995 | 4,216 | 4,808 | 4,120 | 4,243 | 4,549 | 4,013 | 4,983 | 4,799 | 5,903 | 5,480 | 5,677 |
| 2018 | 5,674 | 4,603 | 4,718 | 4,967 | 5,483 | 4,853 | 4,903 | 4,769 | 3,695 | 4,146 | 5,311 | 5,477 |
| 2019 | 5,392 | 4,452 | 5,147 | 5,187 | 4,991 | 5,130 | 5,278 | 5,403 | 4,114 | 4,562 | 5,360 | 5,305 |
| 2020 | 4,775 | 4,130 | 4,956 | 4,787 | 5,291 | 3,882 | 4,712 | 4,999 | 3,877 | 4,881 | 4,465 | 4,574 |
| 2021 | 5,129 | 4,495 | 4,931 | 4,435 | 5,354 | 5,274 | 4,463 | 4,108 | 4,252 | 5,136 | 4,949 | 5,392 |
| 2022 | 5,515 | 4,733 | 5,315 | 4,782 | 5,696 | 4,798 | 4,857 | 5,014 | 5,069 | 5,961 | 5,534 | 5,321 |
| 2023 | 5,799 | 4,973 | 5,387 | 4,069 | 4,768 | 4,575 | 5,759 | 5,706 | 4,221 | 3,990 | 5,605 | 5,734 |
| 2024 | 5,775 | 5,091 | 5,316 | 4,106 | 6,031 | 4,581 | 4,578 | 5,095 | 4,581 | 5,483 | 5,359 | 5,550 |
| 2025 | 5,657 | 4,902 | 4,919 | 2,992 | ||||||||
| - = No Data Reported; -- = Not Applicable; NA = Not Available; W = Withheld to avoid disclosure of individual company data. |
| Release Date: 6/30/2025 |
| Next Release Date: 7/31/2025 |