|
Download Data (XLS File) |
|
||||||||
|
||||||||
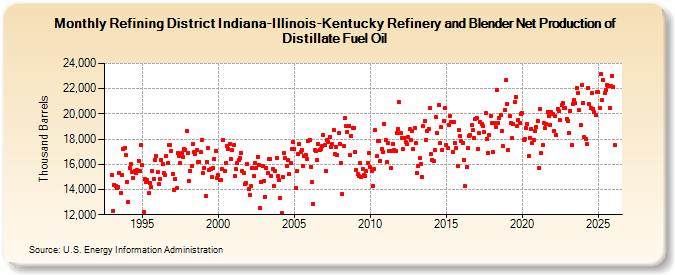
| Refining District Indiana-Illinois-Kentucky Refinery and Blender Net Production of Distillate Fuel Oil (Thousand Barrels) | ||||||||
| Year | Jan | Feb | Mar | Apr | May | Jun | Jul | Aug | Sep | Oct | Nov | Dec |
|---|---|---|---|---|---|---|---|---|---|---|---|---|
| 1993 | 15,136 | 12,301 | 14,362 | 14,259 | 14,142 | 14,217 | 15,291 | 13,739 | 15,161 | 17,222 | 17,283 | 16,719 |
| 1994 | 14,618 | 13,022 | 15,717 | 16,062 | 15,419 | 14,896 | 15,471 | 15,322 | 15,524 | 16,301 | 15,431 | 17,556 |
| 1995 | 15,930 | 12,194 | 14,810 | 14,629 | 14,726 | 13,701 | 14,543 | 14,216 | 15,438 | 14,856 | 16,368 | 16,655 |
| 1996 | 15,370 | 14,424 | 14,839 | 16,341 | 16,056 | 15,314 | 15,186 | 16,698 | 16,089 | 17,528 | 17,537 | 17,065 |
| 1997 | 15,238 | 13,984 | 14,826 | 14,096 | 16,885 | 16,686 | 16,075 | 16,864 | 16,575 | 17,230 | 17,141 | 18,654 |
| 1998 | 16,907 | 14,644 | 15,491 | 15,836 | 17,578 | 16,973 | 16,785 | 17,163 | 16,195 | 16,204 | 16,948 | 17,951 |
| 1999 | 15,276 | 15,740 | 13,488 | 16,222 | 17,259 | 15,535 | 15,631 | 14,988 | 15,693 | 16,383 | 17,076 | 14,927 |
| 2000 | 15,178 | 14,769 | 14,739 | 15,656 | 17,955 | 15,488 | 16,111 | 17,481 | 17,199 | 17,579 | 16,394 | 17,107 |
| 2001 | 17,531 | 15,087 | 15,600 | 16,124 | 16,347 | 16,486 | 16,918 | 15,434 | 15,338 | 14,461 | 14,526 | 16,016 |
| 2002 | 14,070 | 13,590 | 14,257 | 15,707 | 15,108 | 16,101 | 15,719 | 16,582 | 15,958 | 12,507 | 14,563 | 15,884 |
| 2003 | 14,706 | 13,431 | 15,741 | 15,292 | 16,428 | 16,411 | 15,082 | 15,620 | 14,317 | 15,430 | 16,488 | 15,046 |
| 2004 | 14,732 | 13,338 | 12,150 | 14,970 | 16,889 | 16,490 | 15,876 | 16,353 | 15,211 | 16,073 | 17,229 | 17,759 |
| 2005 | 17,203 | 14,113 | 15,458 | 16,792 | 17,591 | 17,003 | 17,142 | 15,848 | 16,685 | 16,752 | 16,454 | 17,854 |
| 2006 | 17,960 | 15,756 | 14,587 | 12,856 | 17,155 | 17,028 | 16,379 | 17,643 | 17,154 | 17,191 | 17,414 | 18,330 |
| 2007 | 17,495 | 15,463 | 17,910 | 17,772 | 18,179 | 17,385 | 17,574 | 18,731 | 16,819 | 17,395 | 16,777 | 18,468 |
| 2008 | 17,641 | 16,075 | 13,659 | 17,485 | 19,663 | 19,036 | 18,585 | 19,055 | 16,711 | 18,277 | 18,892 | 18,886 |
| 2009 | 16,992 | 15,571 | 15,207 | 15,071 | 16,109 | 15,009 | 15,627 | 15,169 | 15,086 | 15,430 | 16,132 | 16,867 |
| 2010 | 15,766 | 15,447 | 14,295 | 15,635 | 18,698 | 16,645 | 17,876 | 17,850 | 16,299 | 17,249 | 16,970 | 19,210 |
| 2011 | 17,929 | 16,153 | 17,652 | 17,090 | 15,681 | 17,042 | 17,648 | 17,142 | 17,064 | 18,477 | 18,813 | 20,914 |
| 2012 | 18,464 | 18,126 | 17,209 | 18,116 | 17,778 | 17,578 | 18,145 | 18,771 | 17,891 | 18,659 | 17,212 | 18,896 |
| 2013 | 17,665 | 15,273 | 15,868 | 16,467 | 16,024 | 14,984 | 19,001 | 19,455 | 17,964 | 18,657 | 18,829 | 20,480 |
| 2014 | 16,803 | 16,363 | 16,229 | 17,108 | 19,732 | 18,483 | 20,706 | 17,664 | 18,938 | 17,159 | 19,421 | 20,447 |
| 2015 | 17,558 | 17,292 | 19,124 | 19,829 | 19,358 | 17,011 | 19,342 | 17,651 | 17,258 | 15,897 | 18,699 | 18,261 |
| 2016 | 17,820 | 17,691 | 16,372 | 14,246 | 15,747 | 17,255 | 18,269 | 18,294 | 19,082 | 18,696 | 18,073 | 19,594 |
| 2017 | 19,657 | 17,221 | 18,513 | 19,337 | 19,160 | 19,039 | 18,564 | 20,049 | 18,044 | 16,920 | 18,286 | 19,866 |
| 2018 | 19,258 | 16,946 | 19,303 | 18,996 | 21,927 | 19,317 | 19,646 | 19,887 | 18,603 | 17,425 | 20,313 | 22,664 |
| 2019 | 20,809 | 17,137 | 19,840 | 19,295 | 18,064 | 19,176 | 20,911 | 21,374 | 19,033 | 19,530 | 19,250 | 19,957 |
| 2020 | 20,103 | 17,957 | 18,023 | 18,853 | 19,206 | 16,670 | 18,125 | 18,836 | 17,671 | 17,937 | 18,634 | 18,987 |
| 2021 | 19,456 | 15,678 | 20,364 | 16,866 | 17,516 | 19,275 | 18,843 | 19,179 | 20,173 | 19,810 | 19,139 | 20,115 |
| 2022 | 20,013 | 18,677 | 19,804 | 18,317 | 20,413 | 20,232 | 19,495 | 20,675 | 20,870 | 20,438 | 20,486 | 19,612 |
| 2023 | 19,438 | 18,451 | 20,259 | 17,545 | 20,790 | 21,130 | 20,825 | 22,069 | 21,642 | 20,293 | 19,119 | 22,322 |
| 2024 | 20,865 | |||||||||||
| - = No Data Reported; -- = Not Applicable; NA = Not Available; W = Withheld to avoid disclosure of individual company data. |
| Release Date: 3/29/2024 |
| Next Release Date: 4/30/2024 |