|
Download Data (XLS File) |
|
||||||||
|
||||||||
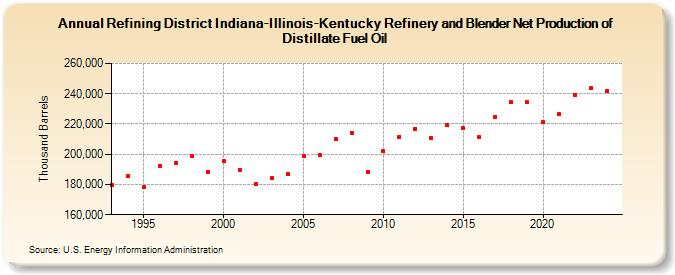
| Refining District Indiana-Illinois-Kentucky Refinery and Blender Net Production of Distillate Fuel Oil (Thousand Barrels) | ||||||||
| Decade | Year-0 | Year-1 | Year-2 | Year-3 | Year-4 | Year-5 | Year-6 | Year-7 | Year-8 | Year-9 |
|---|---|---|---|---|---|---|---|---|---|---|
| 1990's | 179,832 | 185,339 | 178,066 | 192,447 | 194,254 | 198,675 | 188,218 | |||
| 2000's | 195,656 | 189,868 | 180,046 | 183,992 | 187,070 | 198,895 | 199,453 | 209,968 | 213,965 | 188,270 |
| 2010's | 201,940 | 211,605 | 216,845 | 210,667 | 219,053 | 217,280 | 211,139 | 224,656 | 234,285 | 234,376 |
| 2020's | 221,002 | 226,414 | 239,032 | 243,883 |
| - = No Data Reported; -- = Not Applicable; NA = Not Available; W = Withheld to avoid disclosure of individual company data. |
| Release Date: 4/30/2024 |
| Next Release Date: 8/30/2024 |