|
Download Data (XLS File) |
|
||||||||
|
||||||||
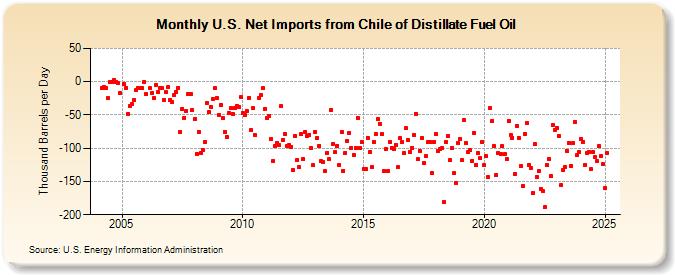
| U.S. Net Imports from Chile of Distillate Fuel Oil (Thousand Barrels per Day) | ||||||||
| Year | Jan | Feb | Mar | Apr | May | Jun | Jul | Aug | Sep | Oct | Nov | Dec |
|---|---|---|---|---|---|---|---|---|---|---|---|---|
| 2004 | -9 | -8 | -9 | -25 | 0 | -1 | 3 | 0 | -2 | -17 | ||
| 2005 | -3 | -9 | -48 | -36 | -34 | -27 | -13 | -9 | -10 | -10 | 0 | |
| 2006 | -19 | -10 | -17 | -24 | -5 | -16 | -9 | -10 | -28 | -16 | -8 | |
| 2007 | -27 | -30 | -20 | -15 | -9 | -75 | -41 | -54 | -44 | -18 | -18 | -43 |
| 2008 | -56 | -108 | -75 | -107 | -102 | -91 | -32 | -46 | -38 | -26 | -10 | -24 |
| 2009 | -50 | -35 | -55 | -75 | -83 | -47 | -40 | -48 | -39 | -36 | -38 | -23 |
| 2010 | -47 | -50 | -44 | -24 | -73 | -40 | -80 | -25 | -20 | -10 | -41 | |
| 2011 | -55 | -51 | -86 | -119 | -96 | -92 | -95 | -37 | -87 | -78 | -96 | -95 |
| 2012 | -98 | -133 | -82 | -118 | -129 | -79 | -116 | -75 | -82 | -80 | -100 | -126 |
| 2013 | -75 | -84 | -96 | -120 | -121 | -135 | -107 | -117 | -42 | -93 | -106 | -96 |
| 2014 | -125 | -75 | -134 | -107 | -89 | -77 | -100 | -110 | -100 | -54 | -100 | -91 |
| 2015 | -131 | -131 | -84 | -106 | -129 | -91 | -79 | -56 | -63 | -78 | -135 | -101 |
| 2016 | -134 | -90 | -99 | -101 | -95 | -129 | -85 | -91 | -107 | -70 | -88 | -105 |
| 2017 | -99 | -80 | -48 | -117 | -104 | -84 | -123 | -112 | -91 | -91 | -138 | -90 |
| 2018 | -79 | -104 | -101 | -100 | -181 | -91 | -82 | -118 | -99 | -138 | -152 | -92 |
| 2019 | -86 | -118 | -58 | -92 | -106 | -103 | -119 | -77 | -125 | -107 | -115 | -91 |
| 2020 | -126 | -112 | -143 | -40 | -59 | -97 | -140 | -107 | -108 | -97 | -109 | -117 |
| 2021 | -59 | -80 | -84 | -139 | -66 | -84 | -127 | -157 | -79 | -62 | -125 | -130 |
| 2022 | -167 | -94 | -143 | -135 | -161 | -165 | -189 | -125 | -116 | -142 | -65 | -72 |
| 2023 | -69 | -81 | -156 | -133 | -129 | -104 | -92 | -127 | -92 | -60 | -110 | -106 |
| 2024 | -86 | -90 | -125 | -107 | -105 | -132 | ||||||
| - = No Data Reported; -- = Not Applicable; NA = Not Available; W = Withheld to avoid disclosure of individual company data. |
| Release Date: 8/30/2024 |
| Next Release Date: 9/30/2024 |