|
Download Data (XLS File) |
|
||||||||
|
||||||||
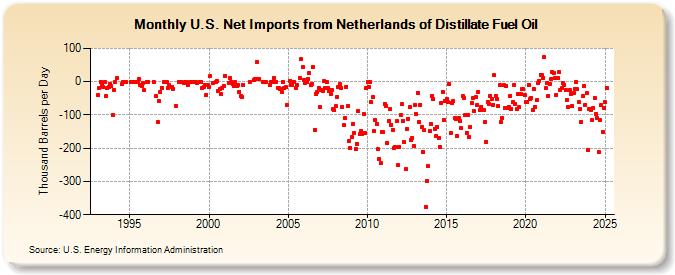
| U.S. Net Imports from Netherlands of Distillate Fuel Oil (Thousand Barrels per Day) | ||||||||
| Year | Jan | Feb | Mar | Apr | May | Jun | Jul | Aug | Sep | Oct | Nov | Dec |
|---|---|---|---|---|---|---|---|---|---|---|---|---|
| 1993 | -41 | -18 | 0 | -6 | -16 | 0 | -44 | -19 | -17 | -7 | -14 | -100 |
| 1994 | -24 | 0 | 10 | -8 | 0 | 0 | 0 | |||||
| 1995 | 0 | 0 | 0 | 0 | 0 | 0 | 7 | -9 | -12 | -5 | -26 | |
| 1996 | 0 | 0 | 0 | -44 | -122 | -57 | -31 | |||||
| 1997 | -18 | 0 | 0 | -20 | -10 | -16 | -22 | -72 | ||||
| 1998 | 0 | 0 | 0 | -5 | 0 | 0 | -9 | 0 | 0 | |||
| 1999 | 0 | -1 | -5 | 0 | 0 | -19 | -15 | -10 | -40 | -9 | ||
| 2000 | -15 | 16 | -3 | 0 | 3 | -28 | -23 | -38 | -20 | -13 | ||
| 2001 | 18 | -3 | 11 | 0 | -7 | -14 | -2 | -12 | -9 | -30 | ||
| 2002 | -44 | -45 | -9 | 0 | 6 | 8 | ||||||
| 2003 | 59 | 7 | 9 | 0 | 0 | -9 | -1 | |||||
| 2004 | 0 | 12 | 0 | 0 | -18 | -19 | -22 | -30 | 0 | -20 | -17 | -70 |
| 2005 | 3 | -9 | -10 | 0 | -19 | -10 | 11 | 68 | 43 | |||
| 2006 | 6 | -4 | -2 | 8 | 27 | -10 | -6 | 45 | -144 | -37 | -32 | -19 |
| 2007 | -77 | -25 | -27 | 1 | -20 | 0 | -19 | -29 | -36 | -24 | -82 | -86 |
| 2008 | -74 | -46 | -17 | -8 | -20 | -75 | -129 | -109 | -15 | -73 | -178 | -199 |
| 2009 | -166 | -126 | -153 | -202 | -187 | -89 | -158 | -147 | -158 | -98 | -153 | -20 |
| 2010 | -1 | -16 | -1 | -62 | -46 | -149 | -115 | -126 | -203 | -233 | -246 | -151 |
| 2011 | -151 | -66 | -72 | -185 | -119 | -83 | -129 | -144 | -198 | -196 | -119 | -252 |
| 2012 | -196 | -100 | -68 | -117 | -180 | -263 | -141 | -111 | -77 | -176 | -170 | -193 |
| 2013 | -69 | -98 | -33 | -121 | -69 | -135 | -210 | -146 | -376 | -298 | -255 | -148 |
| 2014 | -127 | -42 | -52 | -142 | -163 | -137 | -169 | -195 | -63 | -31 | -116 | -58 |
| 2015 | -51 | -62 | -6 | -154 | -63 | -59 | -110 | -113 | -164 | -109 | -118 | -140 |
| 2016 | -44 | -49 | -101 | -153 | -100 | -166 | -135 | -64 | -48 | -89 | -47 | -70 |
| 2017 | -31 | -86 | -75 | -85 | -121 | -180 | -61 | -66 | -42 | -52 | -70 | |
| 2018 | 19 | -43 | -52 | -73 | -10 | -122 | -109 | -11 | -78 | -13 | -80 | -76 |
| 2019 | -42 | -81 | -62 | -9 | -66 | -83 | -38 | -77 | -38 | -23 | -22 | -41 |
| 2020 | -61 | -62 | -9 | -52 | -48 | -84 | -23 | -75 | -56 | -4 | 3 | 21 |
| 2021 | 19 | 12 | 74 | -20 | -3 | -42 | -7 | 9 | 28 | 25 | 11 | -39 |
| 2022 | 11 | 29 | -24 | -20 | -3 | -10 | -26 | -55 | -76 | -25 | -36 | -73 |
| 2023 | -24 | -21 | -10 | -46 | -57 | -79 | -122 | -44 | -12 | -77 | -35 | -206 |
| 2024 | -81 | -84 | -114 | -80 | ||||||||
| - = No Data Reported; -- = Not Applicable; NA = Not Available; W = Withheld to avoid disclosure of individual company data. |
| Release Date: 6/28/2024 |
| Next Release Date: 7/31/2024 |