|
Download Data (XLS File) |
|
||||||||
|
||||||||
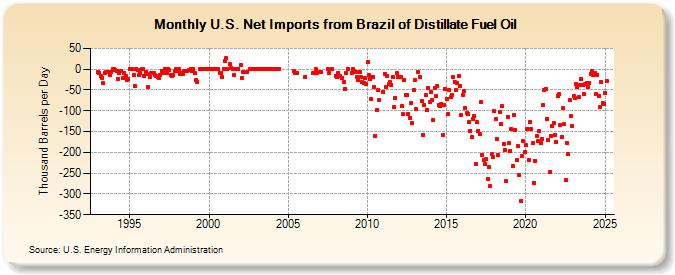
| U.S. Net Imports from Brazil of Distillate Fuel Oil (Thousand Barrels per Day) | ||||||||
| Year | Jan | Feb | Mar | Apr | May | Jun | Jul | Aug | Sep | Oct | Nov | Dec |
|---|---|---|---|---|---|---|---|---|---|---|---|---|
| 1993 | -7 | -8 | -17 | -21 | -34 | -8 | -7 | -7 | -7 | -14 | -7 | 0 |
| 1994 | 0 | -2 | -4 | -23 | -10 | -5 | -21 | -9 | -17 | -25 | -23 | |
| 1995 | 0 | 0 | 0 | -14 | -41 | 0 | -1 | -14 | -10 | 0 | 0 | -17 |
| 1996 | -6 | -11 | -42 | -19 | -9 | -10 | -8 | -15 | -17 | -19 | -21 | -13 |
| 1997 | -4 | -7 | -10 | 0 | -9 | 0 | -3 | -13 | -16 | -14 | -5 | 0 |
| 1998 | -5 | 0 | -11 | -9 | -11 | -4 | -4 | -1 | 0 | -4 | ||
| 1999 | 0 | -9 | -26 | -30 | 0 | 0 | 0 | 0 | 0 | 0 | ||
| 2000 | 0 | 0 | 0 | 0 | 0 | 0 | 0 | -8 | -8 | -20 | 0 | |
| 2001 | 19 | 26 | 0 | 12 | 4 | 0 | -14 | 0 | 0 | 0 | ||
| 2002 | 11 | -21 | -7 | -7 | 0 | 0 | 0 | 0 | 0 | |||
| 2003 | 0 | 0 | 0 | 0 | 0 | 0 | 0 | 0 | 0 | 0 | 0 | 0 |
| 2004 | 0 | 0 | 0 | 0 | 0 | 0 | ||||||
| 2005 | -5 | -9 | -8 | -8 | ||||||||
| 2006 | -18 | -9 | -8 | 0 | -8 | |||||||
| 2007 | -7 | -7 | 0 | -8 | 0 | |||||||
| 2008 | -16 | -19 | -9 | -16 | -21 | -31 | -47 | -8 | 0 | |||
| 2009 | -8 | 0 | -5 | -7 | -18 | -26 | -6 | -20 | -32 | -33 | -22 | -36 |
| 2010 | 17 | -15 | -24 | -72 | -18 | -43 | -160 | -98 | -50 | -75 | ||
| 2011 | -56 | -11 | -43 | -17 | -36 | -32 | -38 | -18 | -92 | -69 | -10 | -19 |
| 2012 | -19 | -88 | -108 | -26 | -63 | -62 | -107 | -117 | -81 | -129 | -51 | |
| 2013 | -25 | -96 | -6 | -20 | -77 | -158 | -86 | -63 | -97 | -46 | -80 | |
| 2014 | -55 | -74 | -123 | -45 | -64 | -40 | -85 | -89 | -84 | -159 | -85 | -47 |
| 2015 | -71 | -108 | -51 | -66 | -63 | -18 | -30 | -49 | -34 | -16 | -41 | -110 |
| 2016 | -63 | -53 | -93 | -106 | -108 | -128 | -148 | -164 | -121 | -113 | -228 | -128 |
| 2017 | -148 | -157 | -80 | -206 | -219 | -229 | -217 | -264 | -235 | -282 | -205 | -212 |
| 2018 | -101 | -121 | -167 | -206 | -102 | -131 | -88 | -179 | -194 | -270 | -114 | -177 |
| 2019 | -197 | -143 | -233 | -109 | -146 | -219 | -185 | -255 | -317 | -209 | -172 | -200 |
| 2020 | -183 | -143 | -219 | -126 | -143 | -177 | -273 | -220 | -161 | -173 | -149 | -177 |
| 2021 | -167 | -85 | -49 | -47 | -120 | -171 | -248 | -160 | -136 | -129 | -159 | -175 |
| 2022 | -65 | -59 | -135 | -162 | -94 | -133 | -267 | -177 | -204 | -74 | -112 | -137 |
| 2023 | -65 | -58 | -44 | -33 | -68 | -37 | -33 | -37 | -59 | -35 | -34 | -27 |
| 2024 | -33 | -11 | -4 | -13 | ||||||||
| - = No Data Reported; -- = Not Applicable; NA = Not Available; W = Withheld to avoid disclosure of individual company data. |
| Release Date: 6/28/2024 |
| Next Release Date: 7/31/2024 |